Pump Modeling in FluidFlow
From Sizing to Performance Curve Analysis
Model Pumps the Way They Actually Work — Inside the System
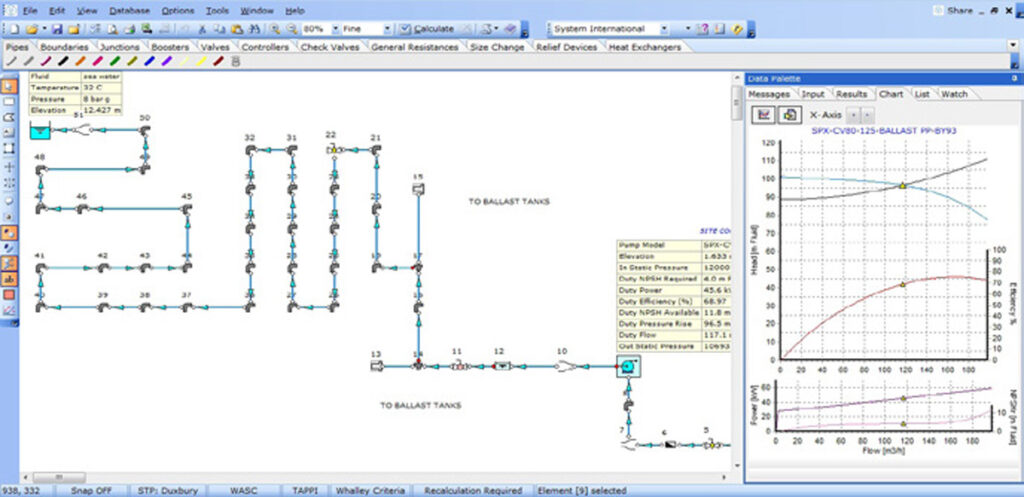
A pump never operates in isolation. Its actual duty point — the flow and head it delivers — is determined by the resistance of the pipes, fittings, valves, heat exchangers, and elevation changes surrounding it. Evaluate a pump outside that context, and you are solving the wrong problem.
FluidFlow models pumps from first principles: auto-size a new pump to meet a design target, or install a specific manufacturer’s curve and let the solver find where the pump actually operates. Either way, the pump is always evaluated against your complete hydraulic network. NPSH available, efficiency, and power are calculated simultaneously — not as separate spreadsheet checks.
This covers the full pump engineering workflow: sizing a pump for a new system, checking NPSH and specifying it for vendor selection, then transitioning to curve-based performance modeling for detailed evaluation and selection.
Stage 1: Pump Sizing — Define What Your System Needs
Size in the Network, Not Against an Assumption
Sizing a pump in FluidFlow means specifying your design target — a required flow rate or a target pressure rise — and building the full pipe network: suction line, discharge piping, elevation changes, inline equipment, and control valves. FluidFlow’s solver finds the operating point where pump delivery meets system demand. The pump is auto-sized to hit your target; the software calculates the required pressure rise (or achievable flow) from the actual network equations.
Because the pump and system are solved together, any change — a larger suction pipe, a different fluid temperature, an added fitting — immediately updates the pump’s duty point. This is sizing in context: the pump is always evaluated against the real system it must serve.
Two Sizing Models
FluidFlow provides two automatic pump sizing modes, selectable per component:
| Sizing Model | You specify | FluidFlow calculates | Typical use |
|---|---|---|---|
| Sized for Flow | Design flow rate | Required pressure rise / differential head | New pump installations — you know your throughput requirement |
| Sized for Pressure Rise | Differential pressure / head | Achievable flow rate | Pressure-limited systems, booster evaluation, series/parallel screening |
Both modes work for centrifugal pumps. For PD pumps, the solver determines the required discharge pressure rise at your specified flow — consistent with how positive displacement units are physically characterised.
Centrifugal vs. Positive Displacement: What Changes in the Model
Centrifugal (kinetic) pumps are represented by a head-adding element. During sizing, FluidFlow solves the required differential head or achievable flow from the network. Once a specific curve is installed (Stage 2), the solver finds the intersection of the pump H-Q curve and the system resistance curve.
Positive displacement pumps deliver near-constant flow per revolution across a wide pressure range. FluidFlow models PD pump performance in the same network alongside centrifugal units. Viscosity slip correction at specific operating speeds is included, accounting for reduced volumetric efficiency at high viscosity or lower speeds.
NPSH Available: Cavitation Risk Screening During Sizing
NPSH available (NPSHA) is calculated automatically as part of every pump solve. It is determined entirely by your suction system — not by the pump itself:
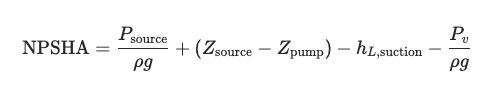
Every term is a design variable you can influence:
| NPSHA contributor | Effect | Design lever |
|---|---|---|
| Source vessel pressure | Higher pressure → higher NPSHA | Pressurize feed tank; check vacuum conditions |
| Elevation head (source level − pump centerline) | Flooded suction adds head; suction lift subtracts it | Raise vessel / lower pump; arrange flooded suction where possible |
| Suction line friction head loss | Always subtracts from NPSHA | Increase suction pipe diameter; reduce fittings and length |
| Fluid vapor pressure | Higher temperature → higher vapor pressure → lower NPSHA | Reduce pumping temperature; evaluate worst-case season |
FluidFlow calculates NPSHA across all operating cases. If NPSH available drops below the required NPSH at any condition, the software flags the risk — during design, not during commissioning.
NPSHA margin practice: The calculated NPSHA is not the value communicated to pump vendors. Industry practice applies a margin — typically around 1 metre or equivalent — to account for calculation uncertainties, operating variations, and long-term system changes.
Operating Cases: Why One Duty Point Is Not Enough
A pump must work across all realistic operating conditions, not only at one design point. FluidFlow makes it straightforward to evaluate multiple cases:
- Normal flow case – the normal flow rate (normal maximum flow rate) in the normal operation defined in the process specifications; aim for operation near the best efficiency point.
- Rated/Design case – the normal flow rate plus an extra margin added to the normal flow rate.
- Maximum flow case – peak production or vessel emptying; verify NPSHA still exceeds NPSHR at elevated flow
- Minimum flow/turndown case – verify flow stays above manufacturer’s minimum allowable flow
- Startup case – fluid properties may differ (cold viscosity, hot vapor pressure); model separately if significant
- Multiple destination cases — if the pump feeds alternate endpoints, each destination may determine a different design parameter (motor size, system design pressure)
Key lesson from multi-destination analysis: The case that determines pump and motor size (highest brake horsepower) is not always the same case that determines piping system design pressure (highest shutoff differential head). Evaluate all cases. Select pump and motor from the highest-power case; establish design pressure from the highest-head case.
What Else the Solved Model Reveals
Once your pump sizing model is solved, FluidFlow immediately surfaces additional design information:
- Pressure profile check — examine static pressure at every node; identify points approaching vapor pressure where unwanted flashing or two-phase flow could occur in inline equipment
- Two-phase flow screening — equipment operating in two-phase service is at risk of erosion and underperformance or slug flow; FluidFlow flags these conditions
- Velocity check — pipe velocities should be investigated across all lines: general piping velocities should be evaluated against economic velocity principles, company or industry standard velocity criteria, and upper limits associated with erosion, noise, or unsafe conditions.
- System design pressure — shutoff differential (duty head × 1.10–1.25, per company practice) plus maximum suction pressure is used as one of the basis for establishing system design pressure.
Stage 2: Performance Curve Modeling — Evaluate the Specific Pump
From Sizing to Curve-Based Analysis
Pump sizing defines what the system requires. Performance curve modeling answers whether a specific pump meets that requirement — and how it behaves across the operating range.
In FluidFlow, you transition from auto-sizing to curve-based mode by disabling the autosizing feature and installing a specific pump curve. The solver then finds the actual operating point: the intersection of the manufacturer’s H-Q curve and the system resistance curve. NPSH available is compared directly against the installed NPSHR curve; efficiency is reported at the duty point.
Reading a Centrifugal Pump Curve
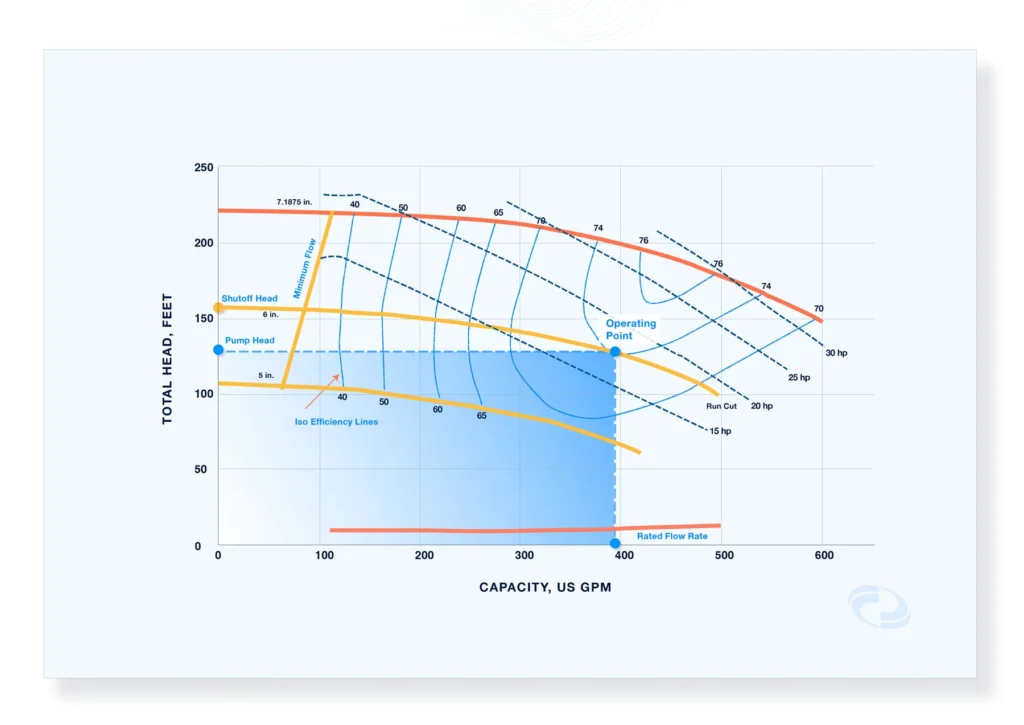
Four regions of the H-Q curve matter for selection and risk screening:
| Region | Definition | Risk if ignored |
|---|---|---|
| Shutoff head | Maximum differential head at zero flow (blocked discharge) | Sets upper bound for piping design pressure; overpressure risk if system is not rated for shutoff |
| Minimum allowable flow | The lowest flow the manufacturer permits for continuous operation | Internal recirculation damage; excessive heat generation at low flow |
| Best efficiency point (BEP) | Flow rate at peak efficiency on the curve | Operating far from BEP increases wear, vibration, and energy cost |
| End of curve / runout | Maximum flow limit of the published curve | Operating at or beyond runout risks overloading the driver and mechanical failure |
NPSHR increases with flow — the faster fluid enters the impeller eye, the greater the pressure recovery required. Verify NPSHA exceeds NPSHR at your maximum operating flow, not just at the rated duty point.
Efficiency curves tell you where the pump is most economical to run and help identify when an oversized pump is consuming excess power across its entire operating life.
Installing and Entering Pump Curves in FluidFlow
To transition from sizing to curve-based mode, disable autosizing on the pump component and assign a specific manufacturer curve. FluidFlow solves the operating point at the intersection of the H-Q curve and system resistance.
FluidFlow provides two ways to load curve data:
Option 1: Select from the built-in database
Open the pump input editor, turn off Automatically Size, then browse the database and select the appropriate entry. Impeller diameter and speed are loaded automatically. Solve — FluidFlow reports achievable flow and differential head.
Option 2: Add a new pump curve entry
Go to Database → Boosters → Centrifugal Pump → Add. Name the entry clearly (e.g., FluidX Pump) for reuse across models. Enter three curve datasets:
| Curve | Required? | Notes |
|---|---|---|
| Flow vs Head (H-Q) | Required | All analysis depends on this |
| Flow vs Efficiency | Recommended | Required for BHP and BEP reporting |
| Flow vs NPSHR | Recommended | Required for NPSH margin comparison |
Optionally enter speed range (RPM) and impeller diameter range (mm) to enable affinity law scaling.
Three curve hygiene checks before use:
- Set min/max flow limits — match the manufacturer curve extents to prevent out-of-range extrapolation.
- Add a zero-head anchor point — add one data point just beyond maximum flow with head = 0 to prevent polynomial inflection beyond the curve.
- Set equation order to Best Fit — applies to both H-Q and NPSHR datasets.
Curve inflection risk: Without the zero-head anchor, the fitted polynomial may turn upward or go negative beyond the last data point, creating a spurious second intersection with the system curve.
Once checks are complete, assign the entry to the pump, disable autosizing, and solve.
Modeling for a Real Duty Point
A common modeling error obscures true pump performance: using components that force a specific flow — autosized orifices, flow control valves set to a fixed flow, or known-flow boundary nodes on the discharge side. These components prevent the solver from finding the achievable flow based on system resistance, and the resulting duty point does not reflect how the pump will actually behave.
The correct approach: represent resistance through pressure-drop characteristics — control valve Cv value, orifice diameter, or K-factor. The solver then determines what flow results from the interaction of pump delivery and system resistance. This is the only way to generate a meaningful pump-versus-system operating point.
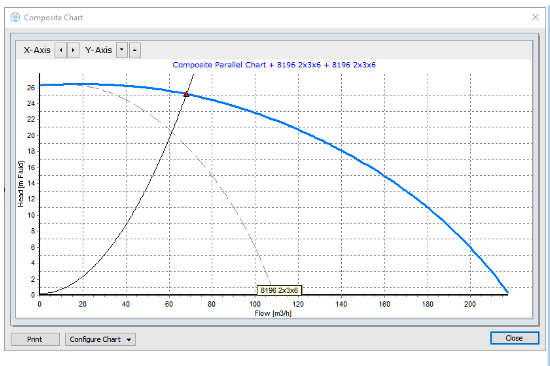
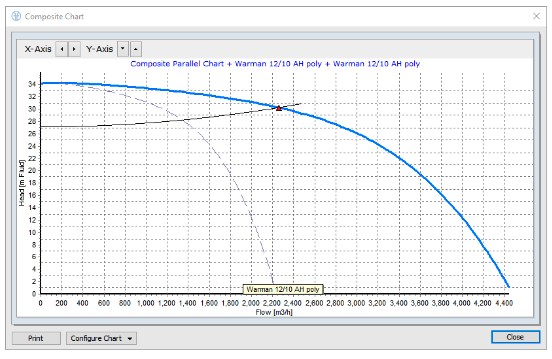
Parallel and Series Pump Configurations
FluidFlow models combined pump arrangements and generate composite performance curves:
- Pumps in parallel — at each head value, parallel pumps contribute the sum of their individual flows. FluidFlow builds the combined H-Q curve and finds the new system intersection. Use parallel arrangements to increase flow capacity while sharing system resistance.
- Pumps in series — at each flow value, series pumps stack their individual head contributions. Use series arrangements to achieve a high differential head not attainable by a single stage.
Both configurations are evaluated against the actual system resistance curve. The resulting operating point, NPSHA margin, power, and efficiency are reported for each pump individually and for the combined arrangement.
Variable Speed and Impeller Trim via Affinity Laws
The affinity laws scale centrifugal pump performance with speed:
- Flow scales linearly with speed ratio
- Head scales with speed ratio squared
- Power scales with speed ratio cubed
FluidFlow applies these relationships directly. Adjust the speed parameter and the H-Q curve, NPSHR curve, efficiency, and duty point, all updated in the same solver. Evaluate VFD energy savings or size a new variable-speed system without rebuilding the model.
FluidFlow also models impeller trim effects within affinity law limitations. VFDs can be modeled in FluidFlow using the Back-Calc Input Tool: specify a target flow rate (or duty condition), and FluidFlow back-calculates the pump speed required to achieve it — eliminating manual affinity law iteration and making it straightforward to evaluate VFD set points during commissioning or revamp assessments.
Note: Affinity laws are approximations. For final revamp confirmation or large trim reductions, vendor re-rate data is required.
Viscosity Correction
High-viscosity fluids reduce centrifugal pump head and efficiency while increasing power draw. FluidFlow applies HI 9.6.7 (Hydraulic Institute standard for the effects of liquid viscosity on rotodynamic pump performance) to automatically correct the water-based H-Q and efficiency curves for viscosity effects. When the viscosity correction option is active, changing the fluid temperature or switching to a more viscous fluid updates the corrected curves and operating point in the same solve — no manual correction factors required.
Pump Selection Risk Screening Checklist
Before finalising a pump selection, verify each item in FluidFlow:
☐ Duty point falls within published H-Q curve limits (not beyond runout)
☐ Duty flow exceeds the manufacturer’s minimum allowable flow at all operating cases
☐ Shutoff differential head is below or consistent with piping system design pressure basis
☐ Pump curve is not too flat near shutoff (flat curves near shutoff are prone to unstable operation and pump trips under small flow variations)
☐ NPSHA exceeds NPSHR at all operating cases — including maximum flow
☐ Duty point is near BEP for continuous-duty applications (typically 70–110% of BEP flow)
☐ Motor/driver is sized from the highest-power operating case, not just rated duty
One Model, Both Stages
The pump sizing model and the performance curve model are the same FluidFlow network file — at different stages of the design process. During sizing, auto-size is active, and the solver finds what the pump must deliver. During performance evaluation, a specific curve is installed, and the solver finds where that pump actually operates. The pipe network, fluid properties, boundary conditions, and operating cases carry over unchanged.
| Capability | Stage 1: Sizing | Stage 2: Curve Modeling |
|---|---|---|
| Duty point calculation | ✓ Auto-sized to target | ✓ Curve ∩ system resistance |
| NPSHA calculation | ✓ Automatic | ✓ Compared against NPSHR curve |
| Multiple operating cases | ✓ | ✓ |
| Parallel / series configurations | ✓ Combined sizing | ✓ Composite curves + system intersection |
| Variable speed / VFD | — | ✓ Affinity laws + Back-Calc Tool |
| Viscosity correction | ✓ Fluid properties auto-applied | ✓ Curve correction for Newtonian fluids |
| PD pump modeling | ✓ Sized for Flow mode | ✓ Same network framework |
| System design pressure screening | ✓ Shutoff head calculation | ✓ Shutoff curve comparison |
| Two-phase / flashing screening | ✓ Pressure profile + warnings | ✓ |
Frequently Asked Questions
Yes. Disable the auto-size feature on the pump component and assign a curve from the database or enter new curve data. The rest of your network model — pipes, boundaries, fluid properties, operating cases — remains unchanged.
Yes. PD pumps are modeled in the same network framework as centrifugal pumps. FluidFlow applies viscosity slip correction at specific operating speeds for PD pumps, accounting for volumetric efficiency loss at high viscosity or lower speeds.
Yes. FluidFlow applies the affinity laws to scale the H-Q curve at any speed. Adjust the speed ratio, and the operating point, efficiency, and NPSHA are all updated. The Back-Calc Input Tool works in reverse: specify your target duty condition, and FluidFlow calculates the required pump speed. Impeller trim effects are also modeled within affinity law limitations.
FluidFlow builds the combined H-Q curve correctly (summing flows at each head value) and finds the new intersection with the system resistance curve. The parallel arrangement often delivers less than double the single-pump flow because system resistance increases with flow — FluidFlow shows exactly where the combined pump set operates.
Enable viscosity correction for Newtonian liquids (water, light hydrocarbons, clean solvents). Disable it for non-Newtonian fluids — the Newtonian correction methods do not apply to fluids with shear-dependent or time-dependent viscosity.
To transition from sizing to curve-based mode, disable autosizing on the pump component and assign a specific manufacturer curve. FluidFlow solves the operating point at the intersection of the H-Q curve and system resistance.
FluidFlow provides two ways to load curve data:
Option 1: Select from the built-in database
Open the pump input editor, turn off Automatically Size, then browse the database and select the appropriate entry. Impeller diameter and speed are loaded automatically. Solve — FluidFlow reports achievable flow and differential head.
Option 2: Add a new pump curve entry
Go to Database → Boosters → Centrifugal Pump → Add. Name the entry clearly (e.g., FluidX Pump) for reuse across models. Enter three curve datasets:
| Curve | Required? | Notes |
|---|---|---|
| Flow vs Head (H-Q) | Required | All analysis depends on this |
| Flow vs Efficiency | Recommended | Required for BHP and BEP reporting |
| Flow vs NPSHR | Recommended | Required for NPSH margin comparison |
Optionally enter speed range (RPM) and impeller diameter range (mm) to enable affinity law scaling.
Three curve hygiene checks before use:
- Set min/max flow limits — match the manufacturer curve extents to prevent out-of-range extrapolation.
- Add a zero-head anchor point — add one data point just beyond maximum flow with head = 0 to prevent polynomial inflection beyond the curve.
- Set equation order to Best Fit — applies to both H-Q and NPSHR datasets.
<aside> ⚠️
Curve inflection risk: Without the zero-head anchor, the fitted polynomial may turn upward or go negative beyond the last data point, creating a spurious second intersection with the system curve.
</aside>
Once checks are complete, assign the entry to the pump, disable autosizing, and solve.
Start Modeling Pumps in Your System
Download FluidFlow today
with full access to pump sizing, performance curve modeling, pipe sizing, control valve sizing, and all FluidFlow modules.
Questions?
Contact [email protected] or call +44 28 7127 9227.