Slurry Flow and Non-Newtonian
Fluid Modeling
Simulate liquid-solid flow in settling and non-settling behavior, model non-Newtonian viscosity without the complexity.
Core Slurry & Non-Newtonian Capabilities
Prevent settling, manage wear, and size pumps and pipelines correctly.

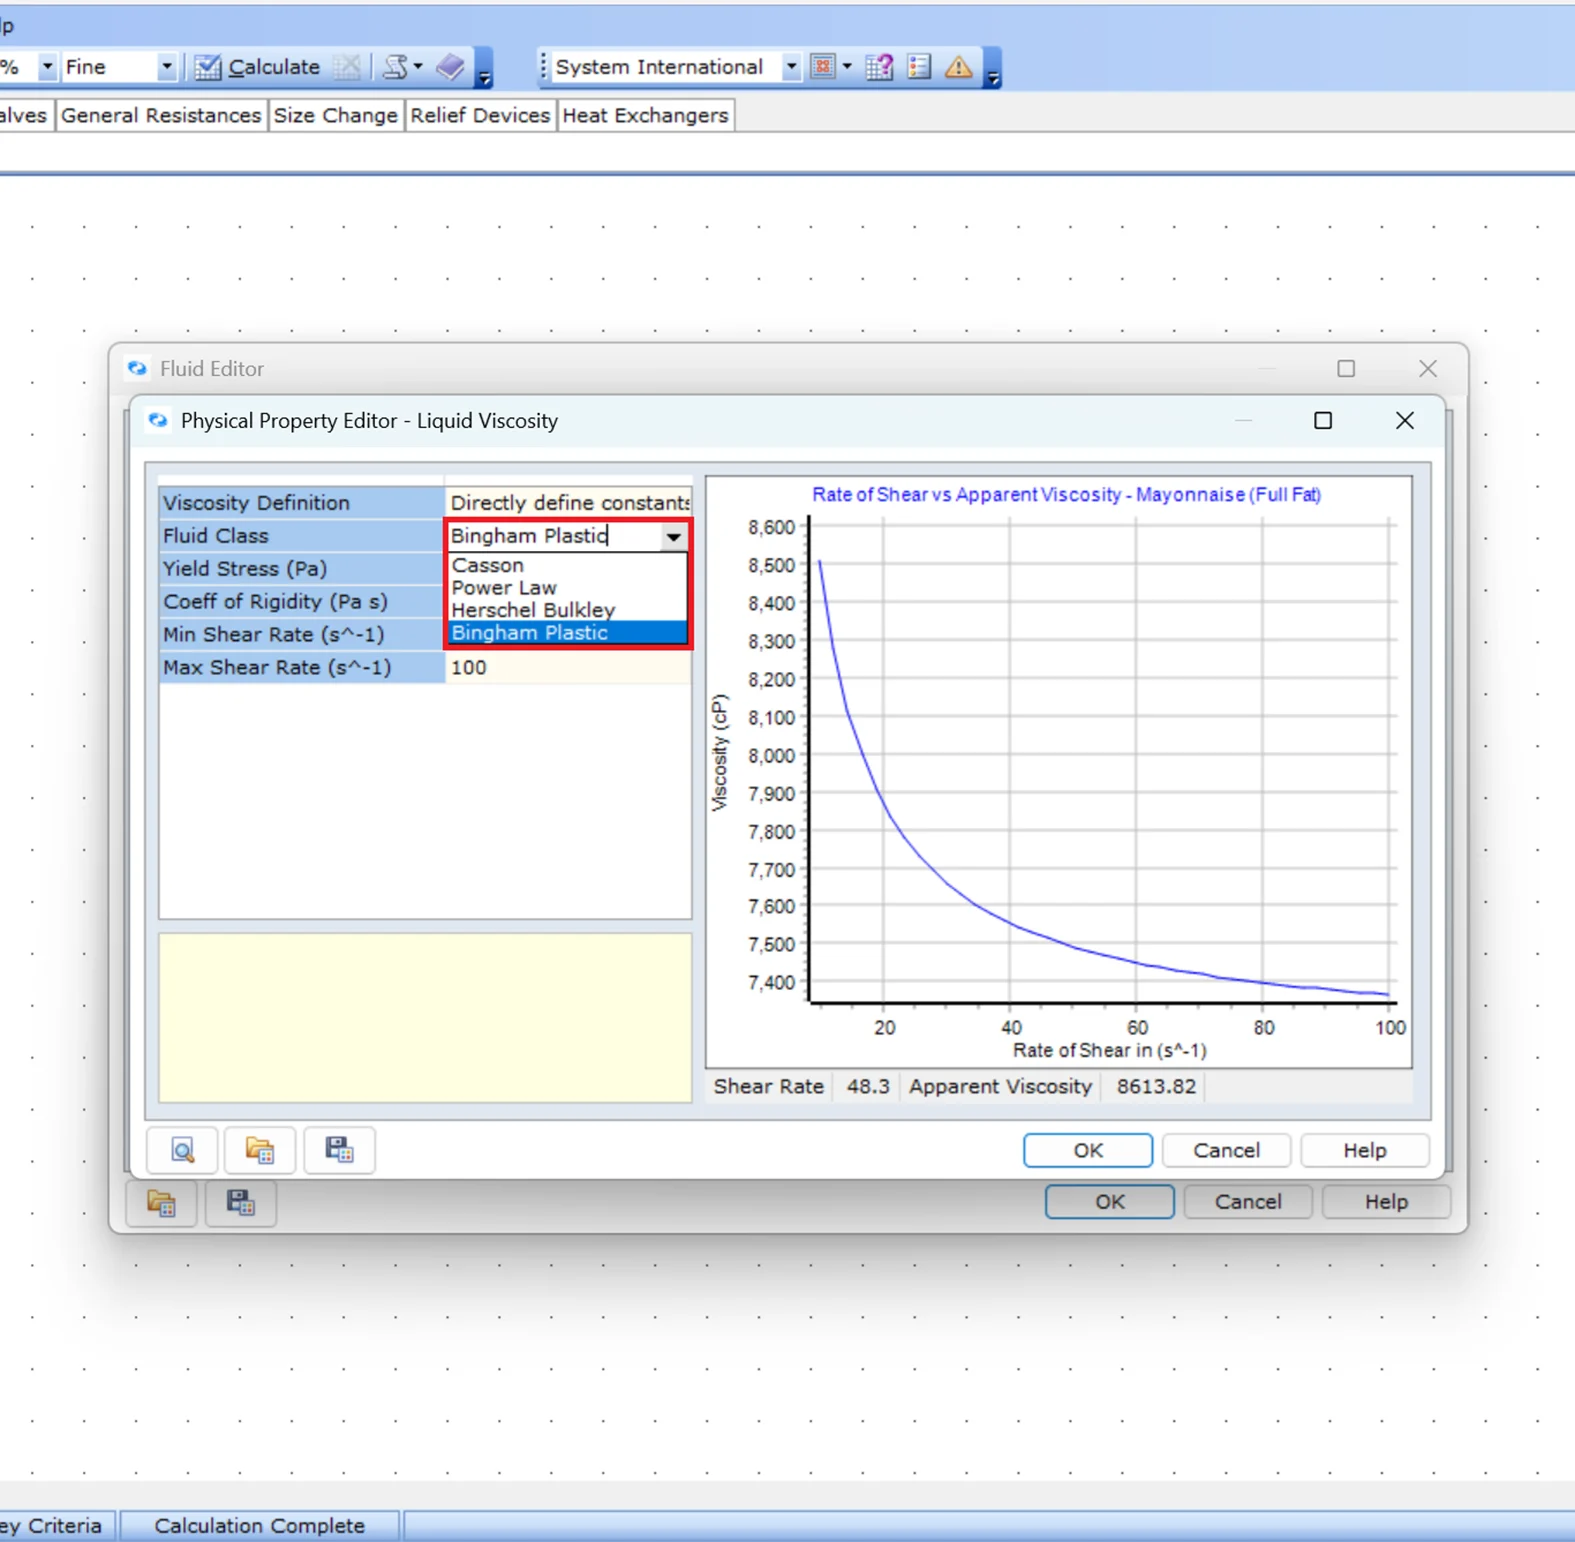
Non-Newtonian Viscosity Modeling
Model viscosity changes using Power Law, Bingham Plastic, Casson, and Herschel–Bulkley models.
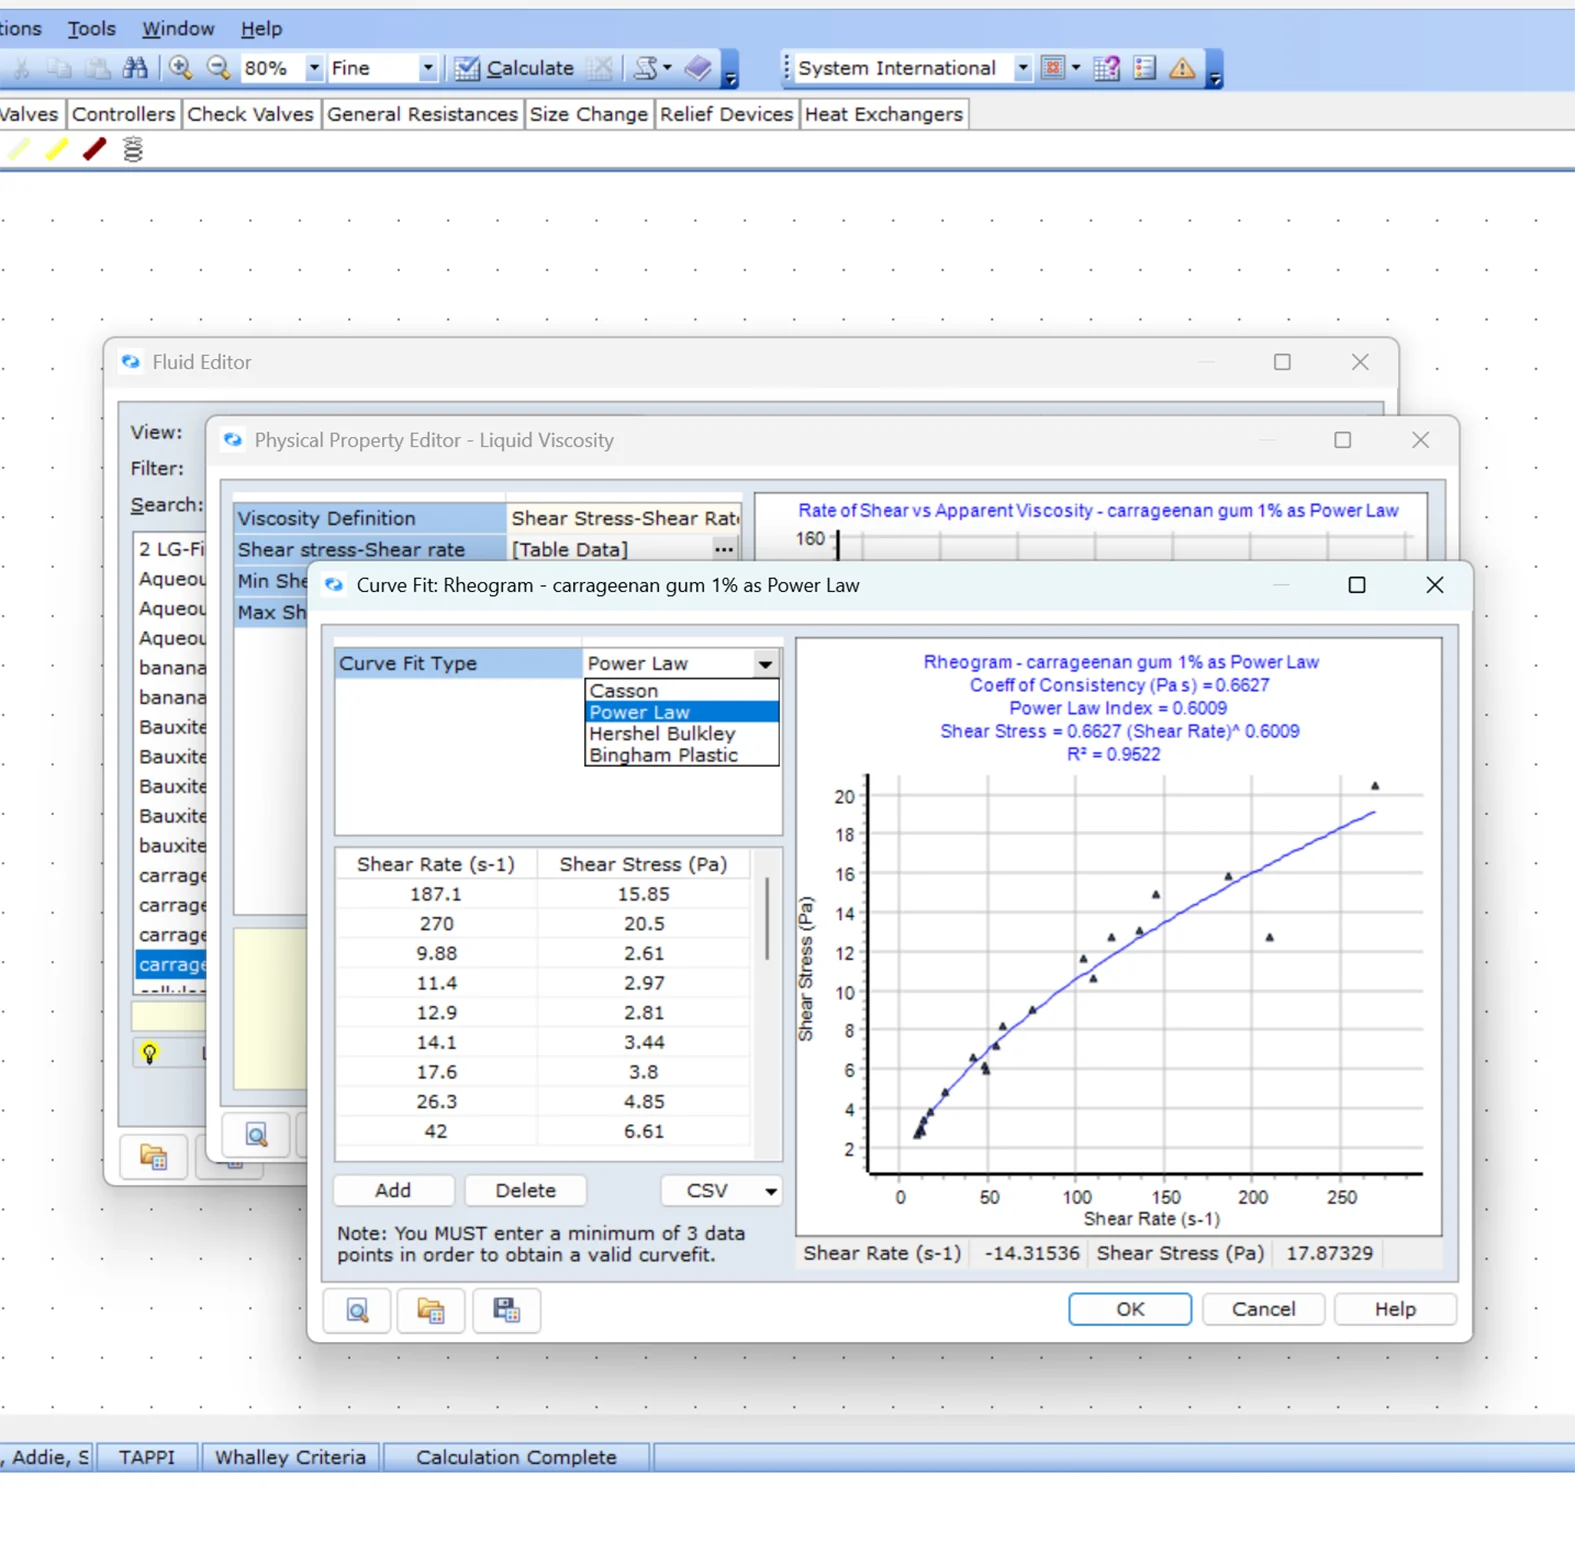
Rheology Model Selection
Easily select best fit non-Newtonian viscosity model from rheology data.
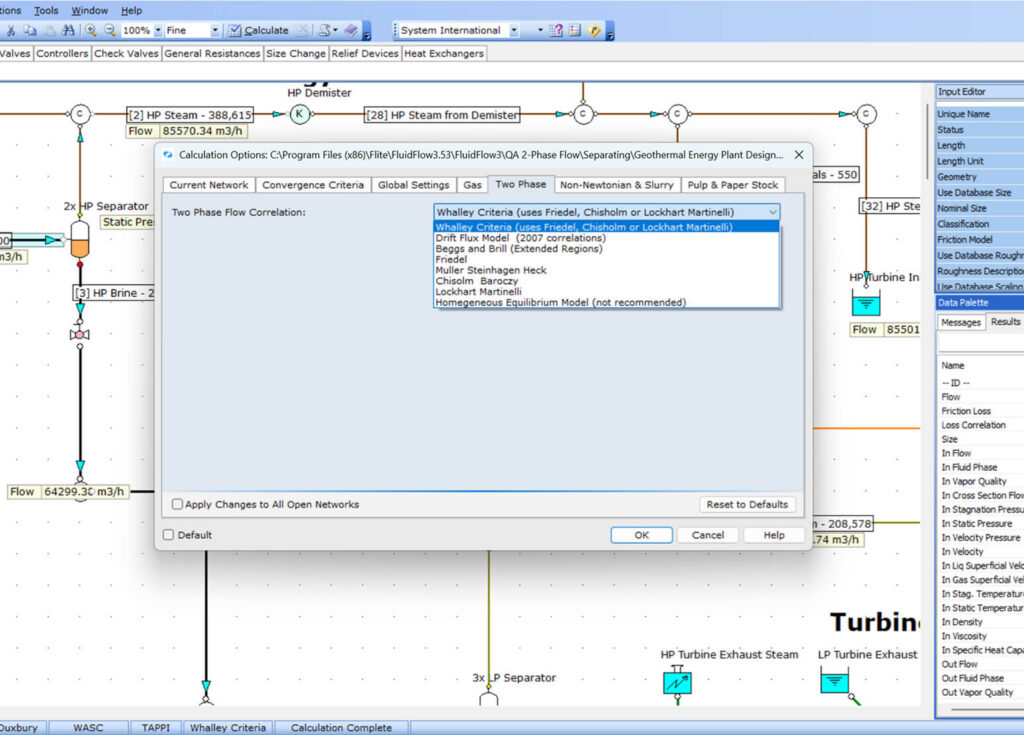
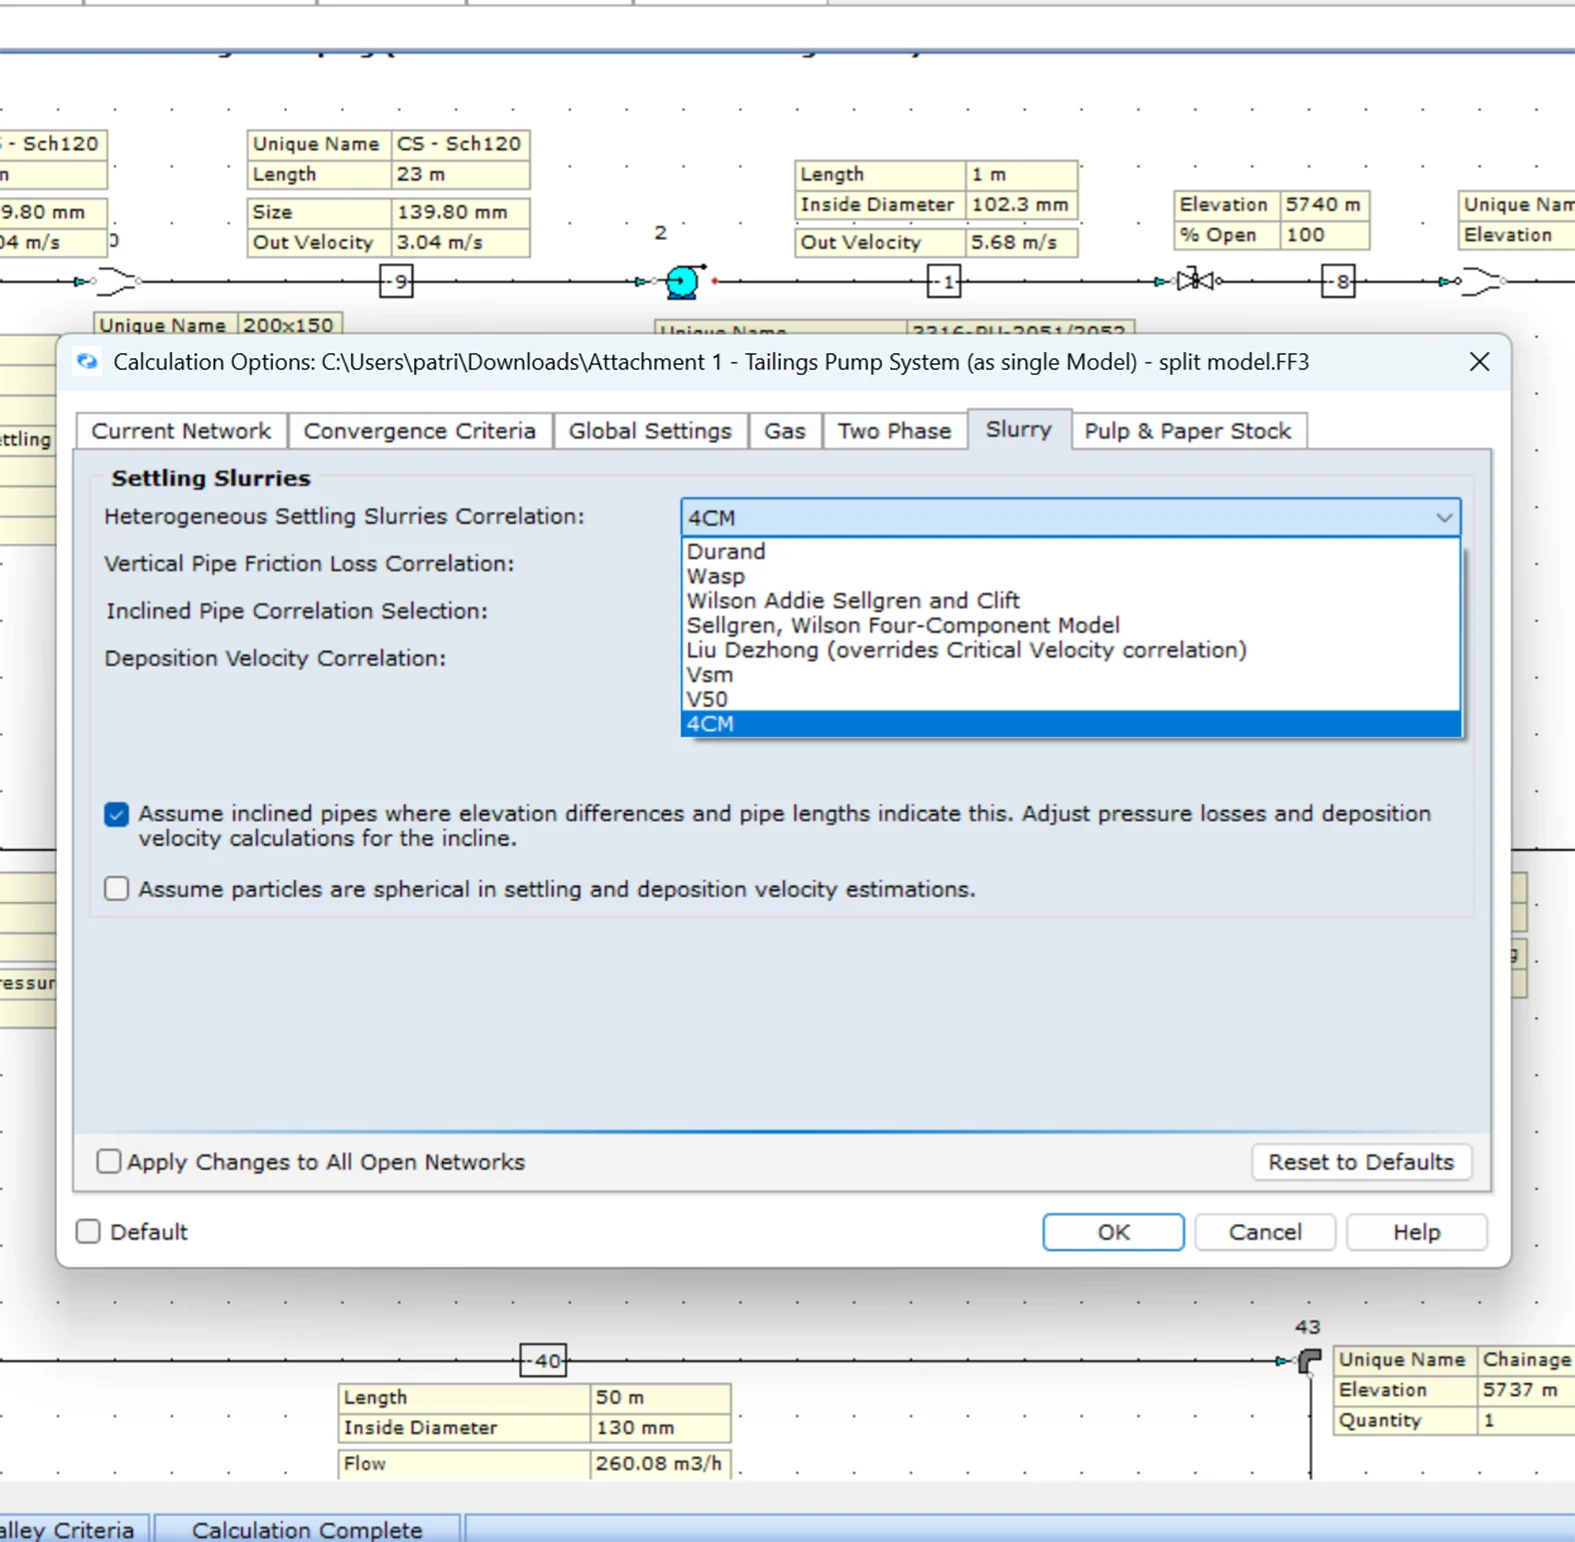
Industry-Accepted Settling Slurry Flow Friction Loss & Deposition Models
Apply proven methods including Durand, Wilson-Addie-Sellgren-Clift, WASP, Liu Dezhong, VSM, V50, and the 4 Component Model (4CM).
Predict deposition velocity using WASC generalized relationships, particle-size-based methods, and GIW VSCALC with automatic inclination corrections.
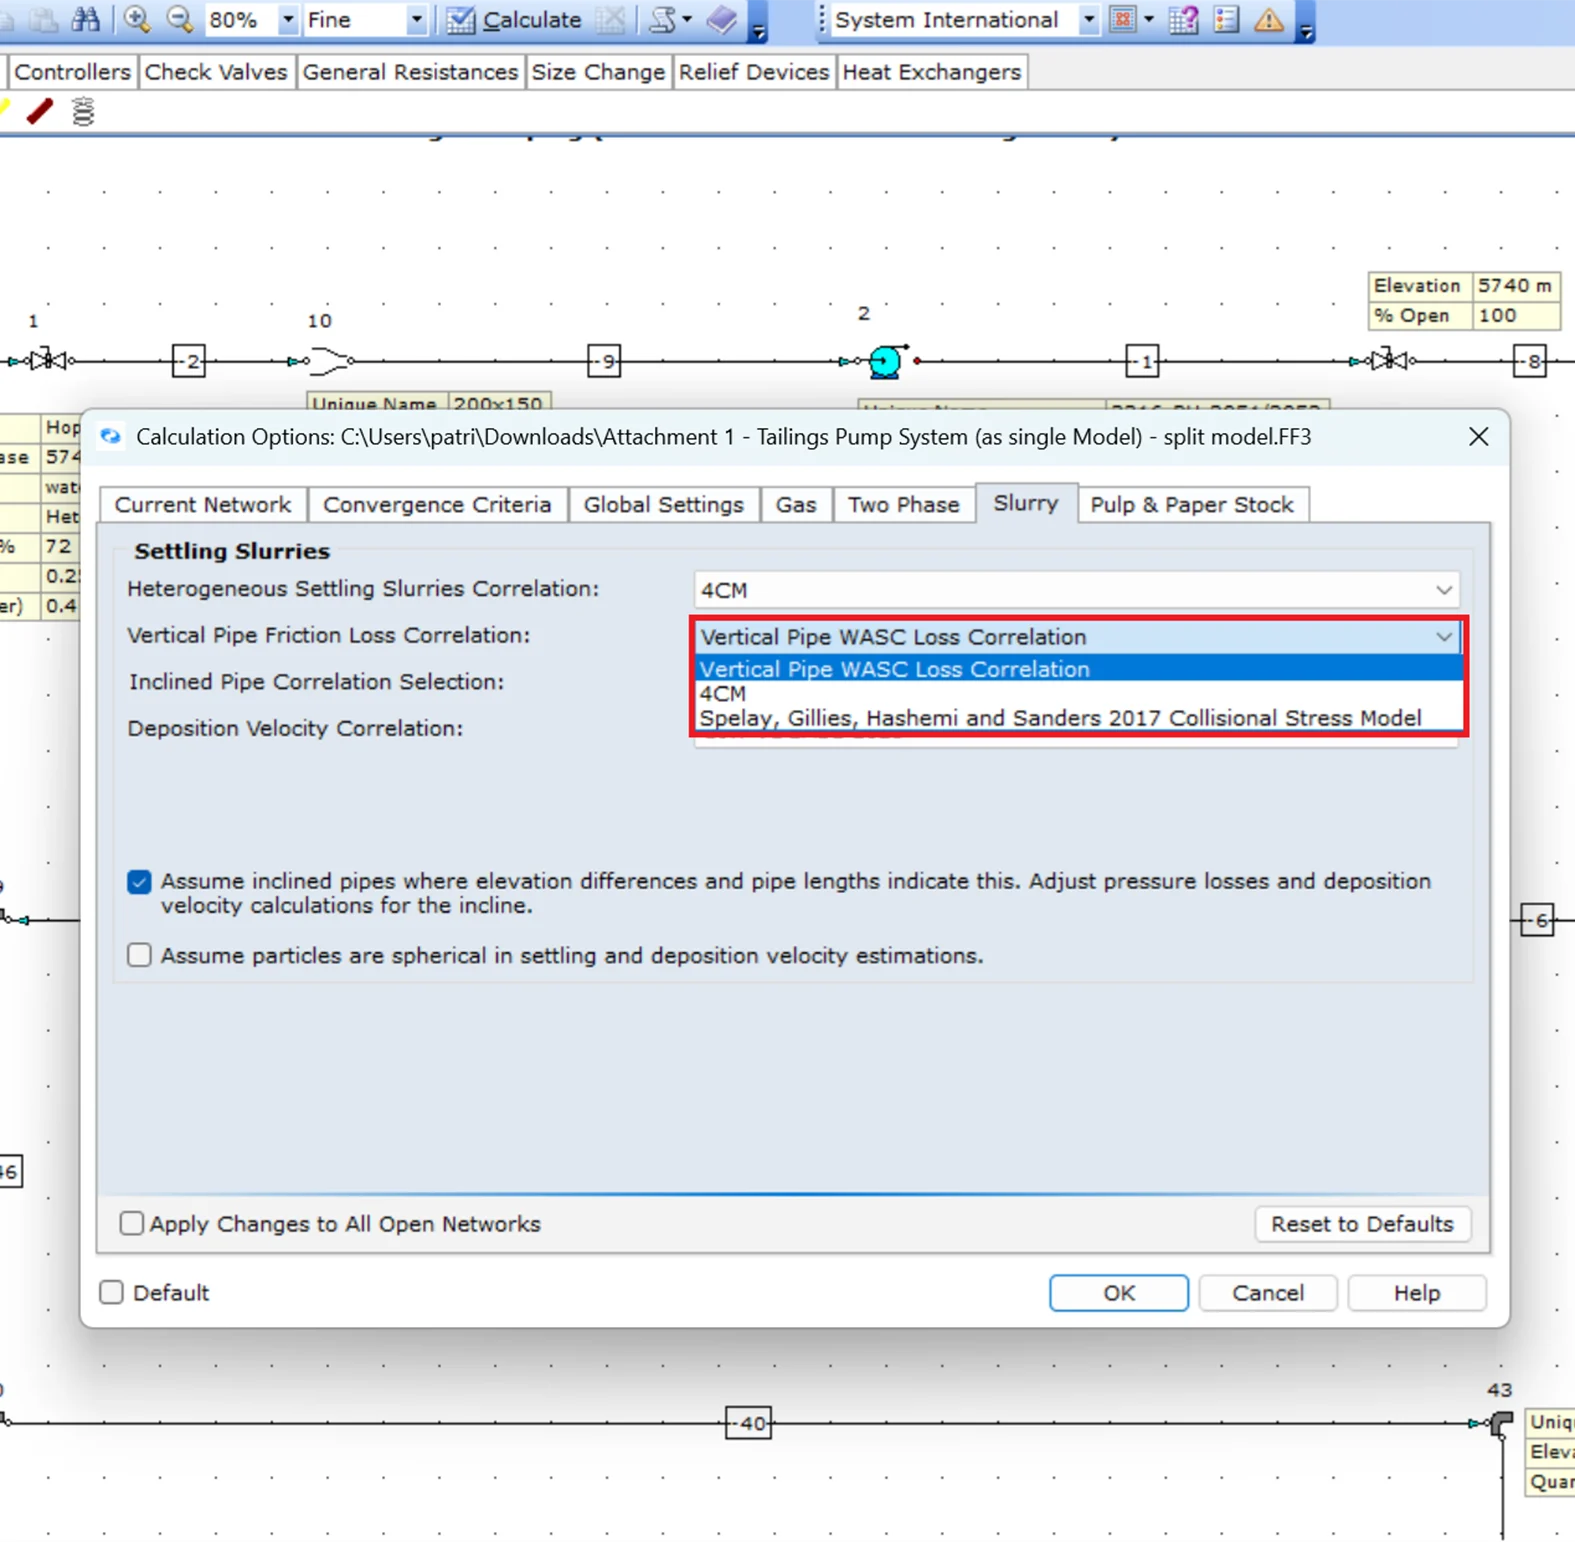
Configurable Settling Slurry Vertical Friction Loss Models
Model vertical slurry flow using Vertical WASC, 4CM, and Spelay et al. collisional stress models.
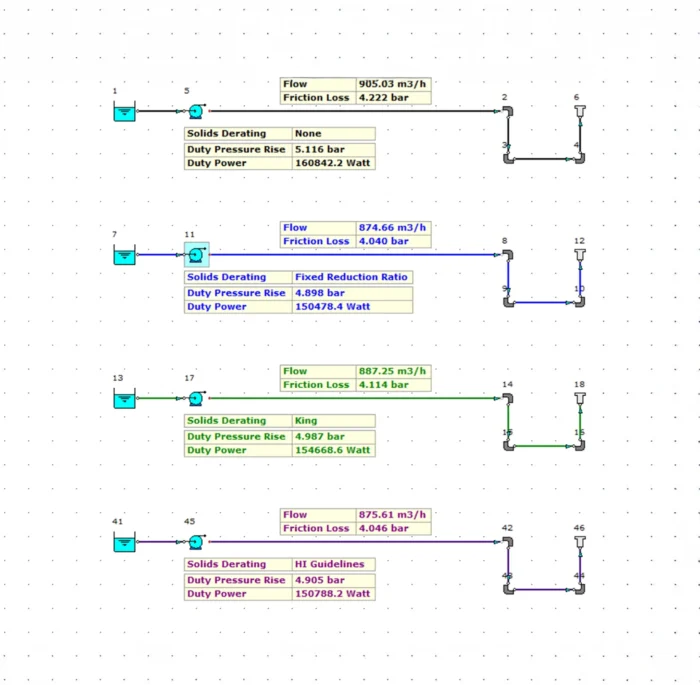
Slurry Centrifugal Pump Modeling
Model the drop in pump performance caused by non-Newtonian viscosity and solids-related losses using well-recognized methodologies.
Why Engineers Choose FluidFlow for Slurry Systems
FluidFlow’s slurry flow simulation delivers precise particle transport calculations to accelerate design cycles and ensure optimal system performance.
Simple but Powerful
User interface allow simplified application and analysis of complex settling slurry flows.
Proven Calculation Accuracy
Applies up to date industry accepted methods for modeling settling slurry flows.
Modeling Versatility
Model slurries as settling or non-settling within one solution
Industry-Specific Applications
Mining & Metals
Key Capabilities
Example Systems
Mineral Processing
Key Capabilities
Example Systems
Oil & Gas
Energy
Application
Key Capabilities
Example Systems
Food Processing
Wastewater
Trusted Across Industries
Over 1,000 companies worldwide rely on FluidFlow to design and optimize critical slurry and liquid transport systems.
“It would not have been possible to analyze the network manually. With the help of FluidFlow, it took us 20 days to successfully build a pipe network model, analyzed it, size the orifice plates, and submitted a design report to the client.”
What Sets Us Apart
Purpose-Built for
Slurry Systems
Unlike generic pipe flow software adapted for slurry use, FluidFlow was engineered specifically for complex slurry transport—delivering superior integration between slurry properties and system hydraulics without simplifying assumptions.
Proven Industry Standard
Trusted by 1,000+ companies across mining, dredging, and heavy industry for over 40 years—continuously updated with the latest slurry research and methodologies including 2023 industry standards.
Exceptional
Design Efficiency
Engineering teams achieve 40-80% time reduction compared to spreadsheets and traditional methods, completing complex slurry system designs in hours instead of weeks while improving accuracy.
Experience FluidFlow Today
What’s Included in your Free Trial:
Full Professional Features
Access to all simulation modules and advanced tools
14 full days
Plenty of time to test with your real projects
Sample Projects Included
Pre-built examples to get you started immediately
Live Support During Trial
Get help from our engineering team via chat and email