Control Valve Sizing Software
Cv & ISA 75.01 | FluidFlow
Size Control Valves in the Network, Not on a Spreadsheet
A control valve sized in isolation will have a Cv value. What it won’t have is context. How much of the system pressure drop does that valve actually take? What happens at turndown? Does the valve still control when upstream or downstream conditions shift?
FluidFlow calculates Cv for liquid and gas service per ISA 75.01.01/IEC 60534, then shows you how that valve behaves inside your actual pipe network. You see the pressure drop allocation, check for choked flow, evaluate valve authority, and flag cavitation risk. Preliminary sizing that accounts for what the system actually does to the valve.
The Problem: Standalone Sizing Misses the System
Control valve sizing calculators take inlet pressure, outlet pressure, flow, and fluid properties. They return a Cv. This is necessary but not sufficient.
What the calculator misses:
| Factor | Why it matters |
|---|---|
| Variable system pressure drop | As flow changes, pipe friction changes. The pressure drop available to the valve changes with it. |
| Upstream pump interaction | Pump head varies with flow. The valve sees a different inlet pressure at every operating point. |
| Downstream load changes | Multiple branches, varying demand. The valve’s job changes depending on what the rest of the network does. |
| Choked flow at turndown | At low flow, the pressure ratio across the valve can reach critical. The calculator may not flag this if it only checks the design point. |
Sizing a valve without the system is like selecting a pump without the system curve. You get a number, but you don’t know if it works.
How FluidFlow Works
Control valves can be placed directly into the hydraulic network model, allowing engineers to analyze valve behavior within the context of the complete piping system. Once inserted, FluidFlow solves the full network simultaneously — so pressures, flows, and valve conditions all reflect actual system interaction rather than isolated assumptions.
This enables the following:
- Model pressure drop across the control valve at different system configurations. Because the network is solved as a whole, the pressure drop across the control valve is calculated from the actual upstream and downstream pressures at each operating case — not assumed values. Change a pipe size, adjust a boundary pressure, or switch flow rate and the valve’s pressure drop updates automatically to reflect the new system state.
- Determine control valve Cv. FluidFlow calculates the required Cv (or Kv) per ISA 75.01.01 / IEC 60534 for liquid and gas service. The Cv result is grounded in the network-solved pressures and flows, giving a sizing basis that accounts for how the valve actually shares the system pressure drop with pipes, fittings, pumps, and other equipment.
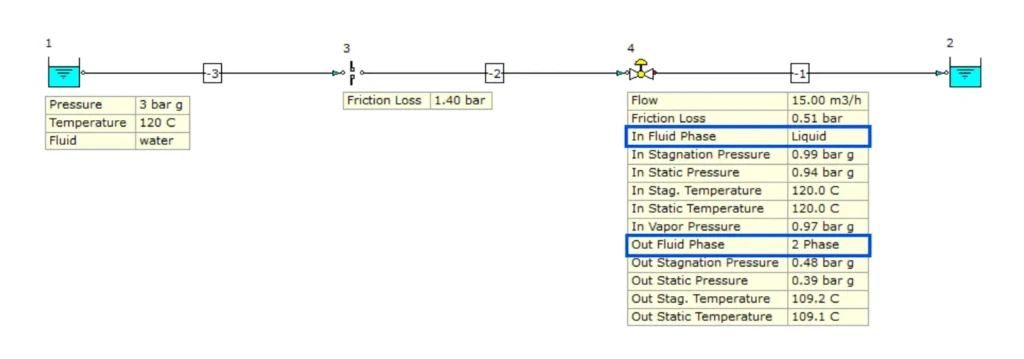
- Investigate control valves for cavitation or flashing issues. For liquid service, FluidFlow checks whether local pressure at the vena contracta drops below the fluid’s vapor pressure using the cavitation indices Kc and Km per IEC 60534. If cavitation or flashing conditions are detected, the software generates a warning, enabling engineers to evaluate trim selection or system modifications before procurement.
- Investigate systems with control valves for potential two-phase flow issues. When a liquid partially vaporizes across the valve (flashing service), FluidFlow tracks the phase change and its effect on downstream conditions. The Joule-Thomson effect — temperature drop during gas expansion — is included in the energy balance, and an active two-phase module license extends this to full two-phase flow calculations in the downstream network.
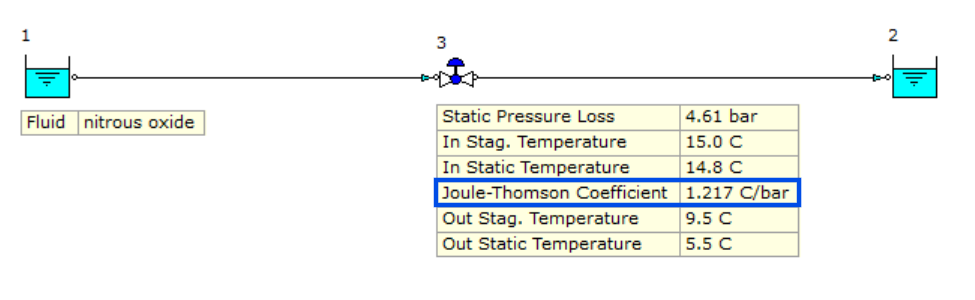
- Model the Joule-Thomson effect across control valves. When gas expands through a control valve, temperature drops as pressure decreases — even without external heat transfer. FluidFlow accounts for this Joule-Thomson cooling in its energy balance, updating fluid properties (density, viscosity, and compressibility) at the valve outlet based on the actual network-solved pressures. This is particularly important for gas pressure-letdown applications where downstream temperature must be checked against hydrate formation limits, minimum piping design temperatures, or condensation risk.
- Investigate control valve performance from manufacturer specifications. With automatic sizing disabled, a manufacturer’s valve database record — including the Cv-versus-travel characteristic curve, xT (gas choking factor), FL (liquid pressure recovery factor), Fd (valve style modifier), and nominal valve size — can be applied directly in the model. FluidFlow then reports calculated valve opening percentage for each operating case, enabling a direct check of whether the valve operates within the recommended 20–80% travel range across rated, normal, and turndown conditions.
Key Capabilities
Cv/Kv Sizing per ISA 75.01.01 / IEC 60534
One of FluidFlow’s core capabilities is control valve sizing that conforms to internationally recognised standards. FluidFlow implements the ISA 75.01.01/ IEC 60534 flow equations for both liquid and gas service, giving engineers a calculation basis that is consistent with the same standards referenced by valve manufacturers, engineering codes, and project specifications worldwide.
The sizing capability covers the full range of control valve types used in process systems:
- Pressure control valves — upstream and downstream setpoint configurations
- Flow control valves — sized to a specified flow setpoint within the network model
- Gas control valves — a dedicated compressible-flow element that applies the ISA 75.01.01 gas sizing equations, including compressibility, specific heat ratio, and critical pressure ratio for choked flow detection
- Self-acting pressure reducers and sustainer elements — modelled without external controller signals
Performance Modeling from Manufacturer Data
FluidFlow includes a built-in control valve database where manufacturer specifications can be stored and applied directly in hydraulic models. Once a valve record is saved — covering the Cv-versus-travel characteristic curve, pressure recovery factor FL, gas choking factor xT, valve style modifier Fd, and nominal valve size — it can be selected in any model to switch from auto-sizing mode to a manufacturer-specific performance analysis.
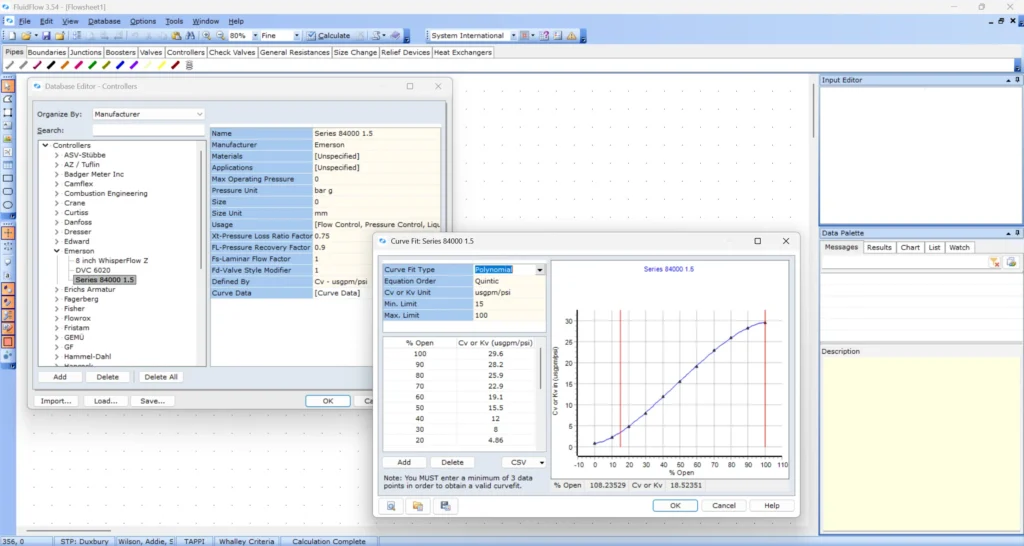
With manufacturer data applied, FluidFlow calculates the valve opening percentage at each operating case based on the actual network-solved pressures and flows. This enables engineers to verify that the selected valve operates within the recommended 20–80% travel range across rated, normal, and turndown conditions, and to identify rangeability or stability concerns before the valve reaches site.
Choked Flow Detection
In gas service, flow through a control valve reaches a maximum once the pressure differential across the valve exceeds the critical ratio defined by the ISA 75.01.01 / IEC 60534 gas sizing equations. FluidFlow applies these equations directly when solving each control valve in the network, making choked flow detection a natural output of the standard calculation — not a separate post-processing step. When choked conditions are identified, FluidFlow reports them alongside the Cv result. Because the network is solved simultaneously, choked flow in one branch is immediately reflected in the pressure distribution.
Cavitation and Flashing
In liquid service, excessive pressure drop creates vapor bubbles that collapse violently downstream, damaging the valve trim and body. FluidFlow checks for cavitation risk at the valve based on actual upstream and downstream pressures from the network solve.
When the valve operates in flashing service (liquid enters, two-phase mixture exits), FluidFlow tracks the phase change. The Joule-Thomson effect, where gas temperature drops during expansion, is accounted for in the energy balance.
System Behaviour and Control Valve Analysis
Because FluidFlow solves the entire pipe network simultaneously, the control valve is always analysed in the context of the complete system — not in isolation. The pressures and flows that the valve sees are calculated results, not assumed inputs, and they update automatically whenever anything else in the model changes.
This makes it straightforward to analyse how the control valve responds to variations in system conditions. Adjust a pipe diameter, change a pump operating point, modify a boundary pressure, or vary the flow demand, and FluidFlow immediately re-solves the network to show the new valve operating point. Engineers can see directly how much of the total system pressure drop the valve carries and whether any changes elsewhere in the system push the valve toward choked flow, cavitation, or an unfavourable travel position — all without leaving the model.
Heat Transfer
Heat loss or gain across control valves can be modeled. Temperature changes affect viscosity, density, and downstream conditions. FluidFlow includes heat transfer in all modules as standard.
Why FluidFlow: Integrated Model, Not a Calculator
A Cv calculator gives you a number. FluidFlow gives you the number in context.
| Standalone calculator | FluidFlow |
|---|---|
| Fixed inlet/outlet pressures | Pressures from network solve (vary with flow) |
| Single design point | Full operating range |
| Manual choked-flow check | Automatic detection across operating range |
| No pump interaction | Pump curve and valve interact in same model |
| Separate pump and pipe sizing | Size pipes, pumps and control valves in the same model |
Control valve sizing and performance analysis can also be carried out in tandem with centrifugal pump curve data. When a pump is modelled using its actual H-Q curve, FluidFlow accounts for how pump head varies with flow, pressure, operating speed or impeller size as part of the network solution.
Use Cases
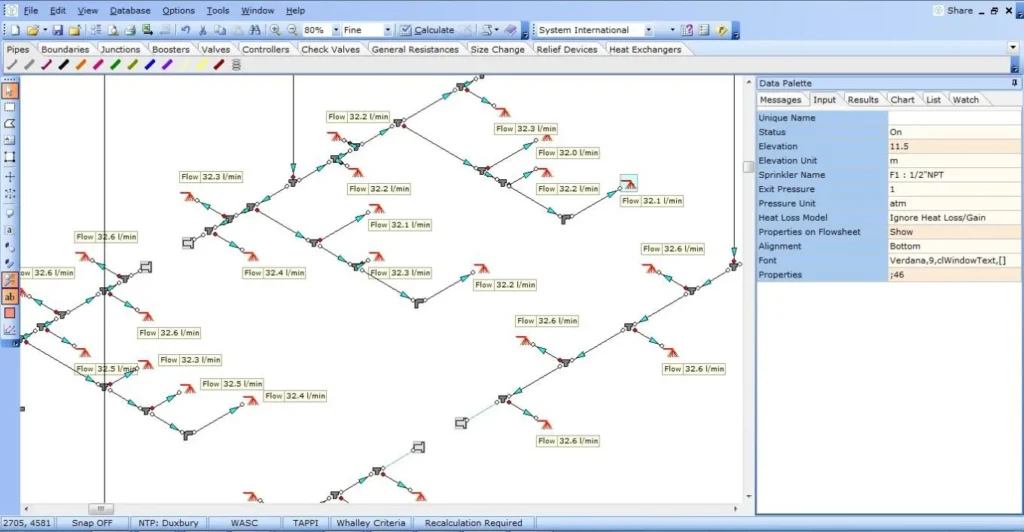
Network Balancing
Multiple branches with different pressure and flow requirements. FluidFlow solves the entire network and shows how each control valve interacts with the others. Adjusting one valve affects pressure distribution throughout the system.
Gas Pressure Letdown
Gas distribution and process systems often require pressure reduction from a high-pressure source to a lower operating pressure. FluidFlow models self-acting pressure reducers and control valves in gas service using the ISA 75.01.01 compressible flow equations, detecting choked flow and accounting for the Joule-Thomson temperature drop across the valve. Downstream temperature and fluid property changes are included in the network solution, supporting hydrate and condensation risk screening.
Valve Selection and Operating Range Verification
When a specific valve has already been selected and manufacturer trim data is available, FluidFlow applies the Cv-versus-travel characteristic to calculate valve opening percentage at each operating case. Engineers can confirm the valve stays within acceptable operating range across all operating conditions and identify rangeability concerns.
Liquid Level and Back-Pressure Control
Control valves used for liquid level or back-pressure control impose a varying pressure drop on the system depending on upstream and downstream conditions. FluidFlow models these configurations with actual network pressures and flow resistances, allowing engineers to size the valve for the full range of operating levels or pressures and verify stable control across all cases.
Resolving Cavitation and Unwanted Flashing
When FluidFlow flags a cavitation or flashing warning at a control valve, the network model becomes the primary tool for identifying a remedy. Because the pressures across the valve are solved from the full system — engineers can directly test the effect of relocating the control valve, adjusting operating conditions, reducing pipe diameter, or using staged pressure reduction to determine if whether the risk is eliminated or reduced.
Frequently Asked Questions
FluidFlow sizes control valves per ISA 75.01.01 and IEC 60534 for both liquid and gas service. These are the internationally recognized standards for calculating the required Cv/Kv value based on fluid properties, pressure drop, and flow conditions.
FluidFlow compares the pressure recovery downstream of the vena contracta against the fluid’s vapor pressure at operating temperature. If the local pressure drops below the vapor pressure, cavitation risk is flagged. Because FluidFlow solves the full network, the upstream and downstream pressures are calculated values, not assumptions.
Yes. When gas expands across a control valve, temperature drops due to the Joule-Thomson effect. FluidFlow includes this in the energy balance, which affects downstream fluid properties, viscosity, and potential for condensation or hydrate formation.
Start Sizing Control Valves in Your System
Download FluidFlow today
Control valve sizing and performance analysis is a network problem. The valve operates against pressures and flows determined by the entire system.
Questions?
Contact [email protected] or call +44 28 7127 9227.