

Approaches in Slurry Modeling
16 min read
Slurries are among the most challenging fluid systems to model accurately. Unlike water or simple process fluids, a slurry’s behavior inside a pipe is governed by a complex interplay of particle size, concentration, carrier fluid properties, and flow velocity. Get the model wrong and the consequences are real: undersized pumps, blocked pipelines, unplanned shutdowns, and costly overdesign.
This article walks through the established approaches engineers use to model slurries, explains what data each approach requires, and highlights how FluidFlow supports each step — including practical fallbacks for when ideal data isn’t available.
What Is a Slurry, and Why Does It Need a Different Approach?
A slurry is a liquid-solid mixture where solid particles are dissolved, suspended, or transported within a carrier fluid. They appear across virtually every process industry: ore concentrate pipelines in mining, catalyst transport in chemical processing, fruit pulp handling in food production, and sludge transport in wastewater systems.
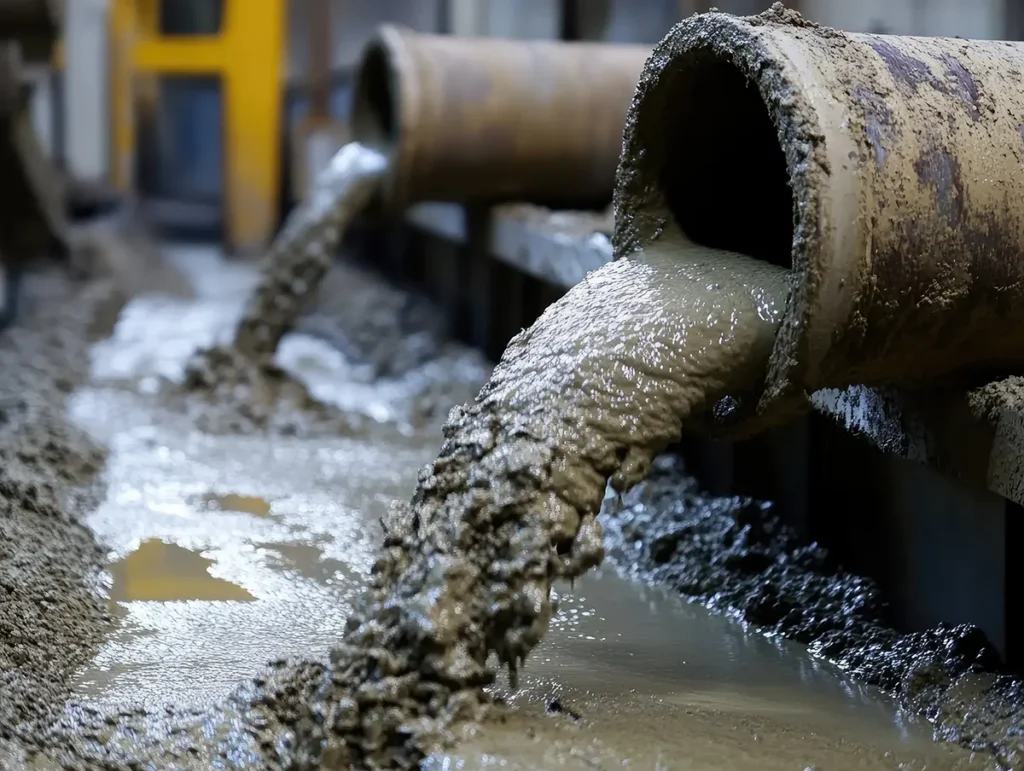
The reason slurries can’t be handled like ordinary liquids comes down to physics. In a simple Newtonian fluid, viscosity is constant — it doesn’t change with how fast you push the fluid. In a slurry, the presence of solids fundamentally disrupts this. Depending on the particle characteristics, you may encounter viscosity that changes with flow rate, a minimum velocity below which solids drop out of suspension and block the pipe, flow regimes that transition unpredictably as velocity changes, and pump performance that degrades significantly compared to manufacturer water-based curves.
Each of these effects demands a specific modeling approach — there is no single universal method that covers all slurry types equally well.
Step One: Classify the Slurry
The first and most consequential decision in any slurry modeling workflow is classification. The approach you apply, the correlations you use, and the data you need all flow from this single choice. Getting it wrong will produce an inaccurate model regardless of how carefully everything else is set up.
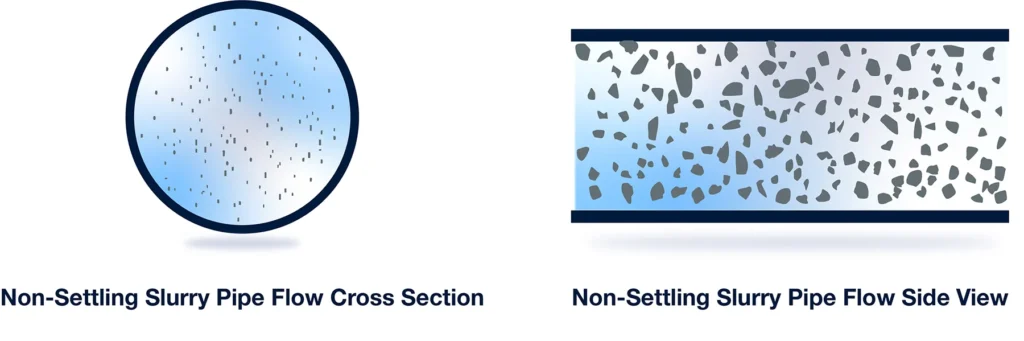
Non-settling slurries contain fine solid particles that remain uniformly suspended throughout the carrier fluid at industry-relevant flow rates. The particles don’t readily settle while the slurry is flowing; they only separate under extreme conditions like intense vibration, chemical changes, or prolonged stagnation. The fine particles interact physically and chemically with the carrier liquid to create a pseudo-fluid that typically behaves as a non-Newtonian fluid. Because the suspension is stable, these slurries can be transported in both laminar and turbulent flow regimes.
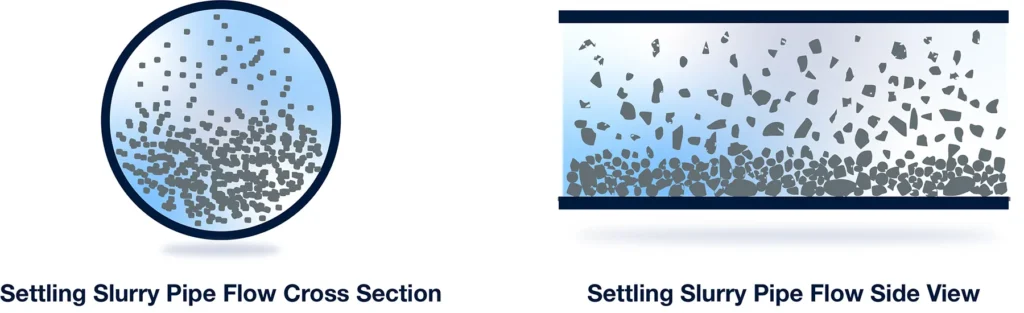
Settling slurries contain coarser particles that will settle to the pipe bottom within approximately one hour of becoming stagnant. Their behavior is strongly velocity-dependent and subject to instabilities at certain flow rates. At low velocities, particles form a stationary bed; as velocity increases, the bed begins to slide; at higher velocities still, particles become suspended in turbulent eddies. Maintaining transport requires continuous particle suspension through turbulence, particle-wall interactions, or a combination of both.
What If You Don’t Have Laboratory Data?
Ideally, slurry classification is informed by laboratory testing. Two types of testing are particularly valuable here. Rheology testing can confirm whether a slurry exhibits shear-dependent viscosity — non-Newtonian behavior — regardless of whether its particles are technically above the coarse-particle threshold. Scale-up tests, conducted in pilot-scale pipe loops, can directly reveal whether a slurry behaves as a settling or non-settling system under realistic flow conditions. Either form of test data takes precedence over particle size rules when available.
When laboratory data isn’t available — which is common at early design stages or when working with novel materials — industry practice provides a well-established fallback: the 75-micron threshold. Slurries with particles 75 microns or smaller are classified as non-settling; those with particles larger than 75 microns are treated as settling. This threshold is based on the observation that particles smaller than 75 microns typically form homogeneous mixtures at industry-relevant velocities within standard pipe sizing.
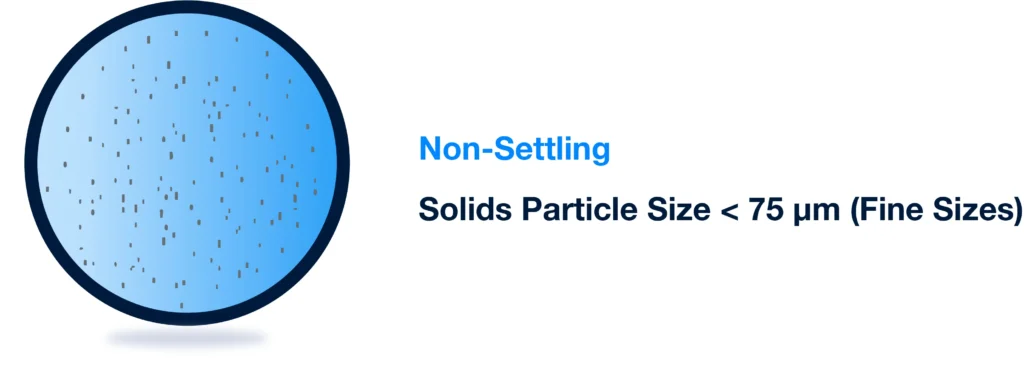
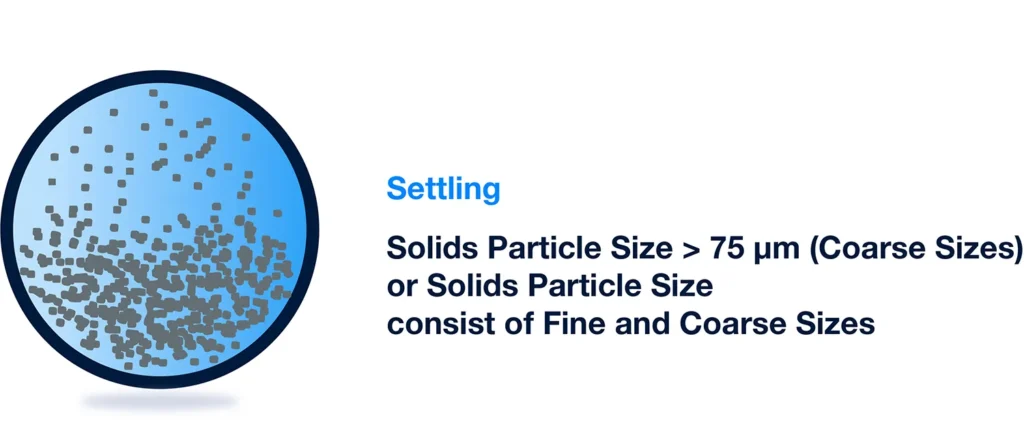
It’s worth emphasizing that the 75-micron rule is a default, not a law. A slurry containing predominantly coarse particles could still behave as a non-Newtonian fluid if laboratory or scale-up testing reveals shear-dependent characteristics. In that situation, the non-Newtonian modeling approach is more appropriate even though particle size alone would suggest otherwise. FluidFlow is designed to accommodate this: the choice of modeling approach is always a deliberate user decision informed by the best available data.
Approach 1: Liquid-Only Flow for Non-Settling Slurries
For non-settling slurries, the established modeling approach treats the slurry as a single-phase fluid with modified viscosity. The carrier liquid and fine particles together form a pseudo-homogeneous mixture, and no separate solid phase tracking is required. In FluidFlow, this is implemented through the liquid-only flow approach.
The key distinction from a standard liquid model is how viscosity is defined. Because non-settling slurries behave as pseudo-fluids with variable viscosity, four established non-Newtonian rheology models are used:
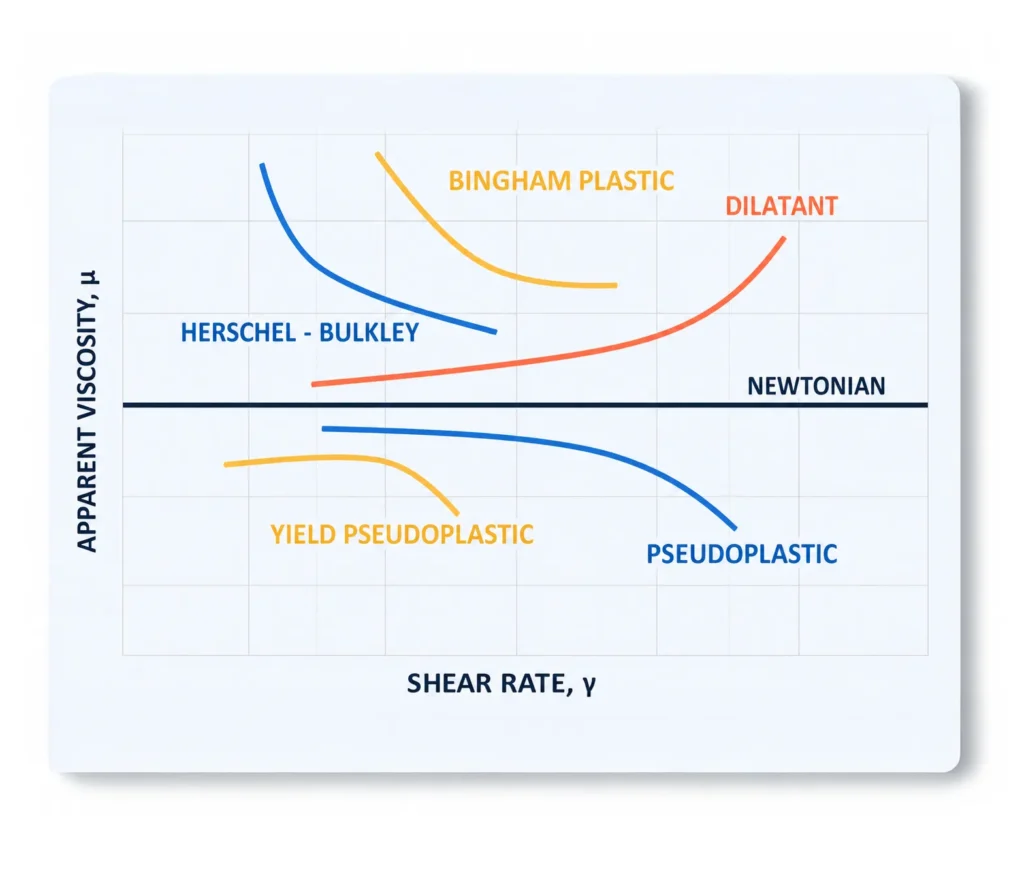
Power Law describes a non-linear relationship between shear stress and shear rate with no yield stress — the curve passes through the origin. The flow behavior exponent n determines whether the fluid thins under shear (pseudo-plastic, n < 1, like paint) or thickens (dilatant, n > 1, like a starch-water solution).
Bingham Plastic introduces a yield stress: the fluid won’t flow at all until a minimum shear stress is exceeded. Once it does, the relationship becomes linear. Concentrated slurries, toothpaste, and ketchup are classic examples.
Herschel-Bulkley combines both features — a yield stress threshold plus non-linear power-law behavior above that threshold. It is the most generalized of the four models and is widely used for mining streams, drilling fluids, and food processing applications like minced fish or raisin paste.
Casson is a yield pseudoplastic model derived from experiments with pigment suspensions in oil. It has been adopted as the standard model by the International Office of Cocoa and Chocolate for interpreting chocolate flow behavior, and is also applied to biological materials like blood and food products such as yogurt, tomato puree, and juice concentrate.
Selecting the Right Rheology Model
Choosing the correct model requires knowing which best describes the shear behavior of your specific slurry. When laboratory viscometry data is available — a table of shear rate versus shear stress measurements — the selection process becomes a curve fitting exercise rather than a judgment call. FluidFlow’s built-in curve fitting routine fits the data to a specified model and evaluates the quality of fit using the coefficient of determination (R²). An R² value approaching 1.0 indicates an excellent fit between measured data and the rheological model equation.
When a slurry could plausibly fit more than one model, the recommended practice is to create multiple fluid entries in the database, each fitted to a different candidate model, then run the simulation with each. This sensitivity analysis reveals how much the choice of rheology model actually affects system results — a particularly valuable step when operating with limited data confidence.
For cases where even rheometry data is unavailable, model constants can sometimes be estimated from published literature for similar materials. Even an approximate estimate, clearly identified as such, is more defensible in a design basis than ignoring non-Newtonian behavior entirely.
Approach 2: Liquid-Solid Flow for Settling Slurries
Settling slurries require a two-phase modeling approach. The carrier fluid and solid particles are modeled separately, and their combined effects on pressure loss, deposition risk, and pump performance are evaluated using empirical correlations developed from large-scale physical testing. In FluidFlow, this is the liquid-solid flow approach.
Setting Up the Model
The starting point is defining the solid phase at the system inlet. In FluidFlow, setting the fluid type to Heterogeneous Settling activates the required solids input fields.
The flow rate for a settling slurry can be defined in three ways: total slurry flow (liquid plus solid combined), solids-only flow, or carrier-only flow. If either component flow is specified, FluidFlow calculates the total slurry flow automatically based on the defined solids concentration, which can be entered as a percentage by volume or by weight.
Solids physical properties — including density, bulk density, sliding bed coefficient, and shape factor — are stored in the FluidFlow database. At minimum, solids density and bulk density are required to run a basic settling slurry calculation. Adding the sliding bed coefficient (typically 0.4–0.5, best determined by testing) and the solid shape factor improves the accuracy of deposition velocity and friction loss calculations, particularly in systems where blockage risk is a concern.
Particle Size Distribution: Working with What You Have
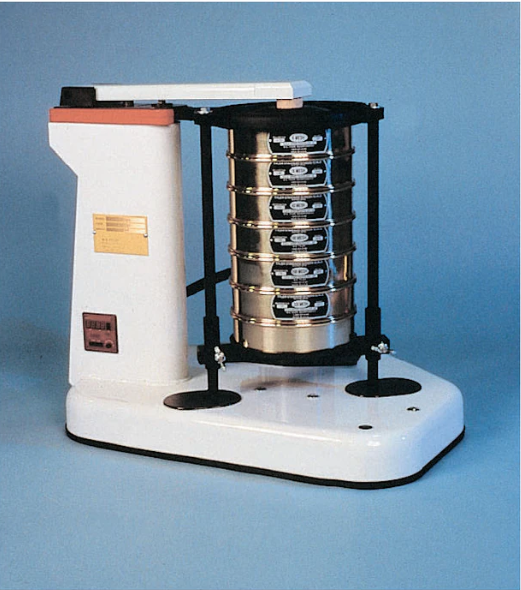
Particle size is the most influential variable in settling slurry calculations. Two input approaches are available in FluidFlow. If full sieve analysis data is available, the complete particle size distribution can be entered directly, giving the solver the most detailed picture of the solid phase. If detailed sieve data is unavailable, FluidFlow can generate a representative distribution from just two values: d50 (the particle size at which 50% of the sample by weight is smaller) and d85 (the size at which 85% is smaller). These two points define the spread of the distribution, and the solver synthesizes the full PSD from them. This is a significant practical benefit — d50 and d85 are frequently available from material specification sheets, supplier data, or historical plant records, even when a complete sieve analysis is not.
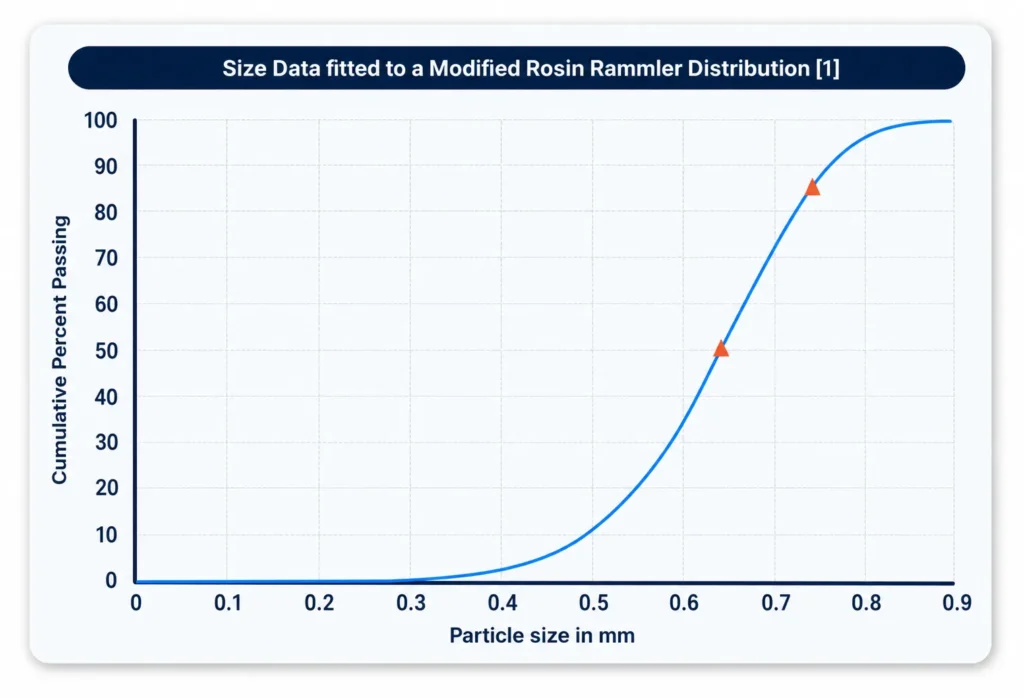
Deposition Velocity: Establishing the Safe Operating Limit
For settling slurries, calculating deposition velocity is not optional — it is the primary safety check of the entire model. Deposition velocity defines the minimum flow velocity needed to prevent solids from forming a stationary bed at the pipe bottom, and operating below it risks a blockage that may require manual intervention to clear.
The primary design criterion is the Maximum Deposition Limit Velocity (VSM): the peak velocity on the stationary deposit zone curve. At velocities above VSM, solids will not form a stationary bed at any concentration. Standard industry practice is to design operating velocities at least 130% of VSM to maintain a safe margin.
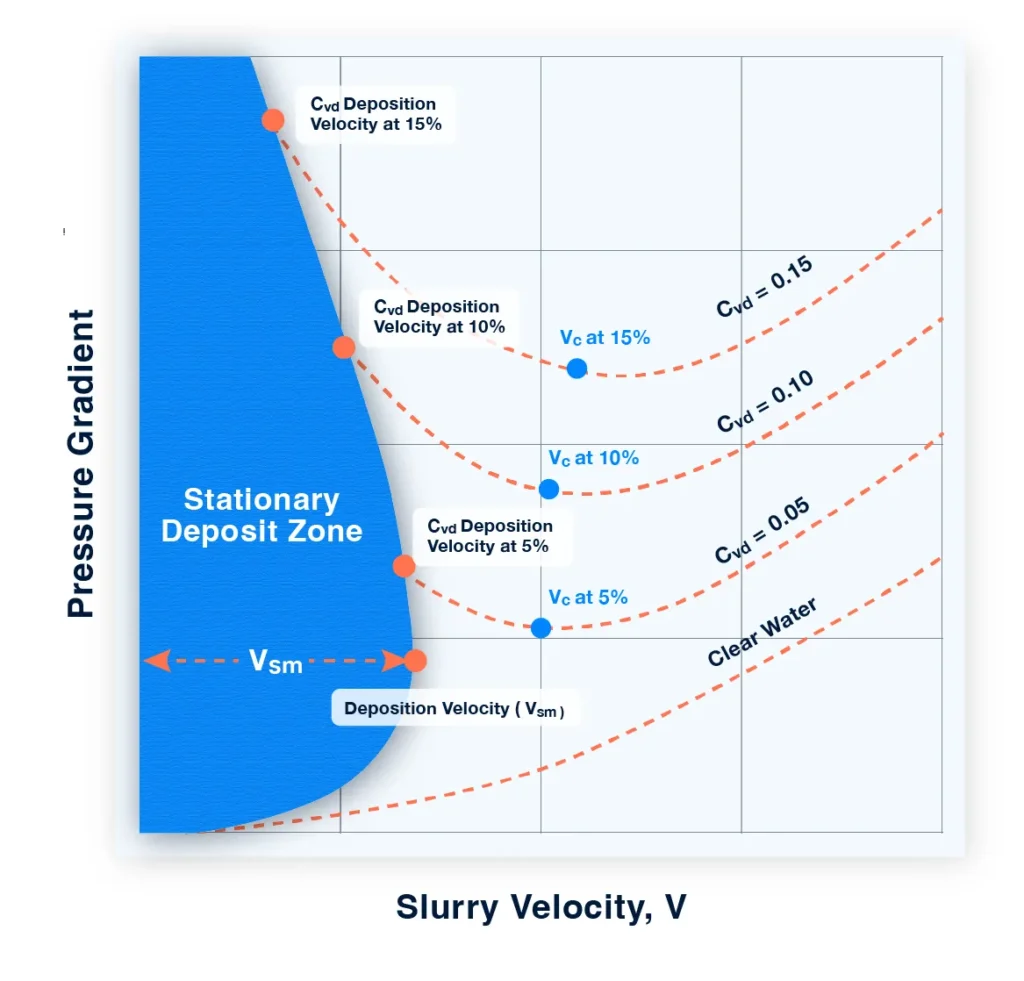
Three empirical correlations are available in FluidFlow for calculating VSM:
The Wilson-Addie-Sellgren-Clift (WASC) method (Wilson 1992) is suited to stratified and heterogeneous flows with d50 above 150 microns. The “As a function of particle size (Wilson 1997)” similarly targets coarser particles and explicitly accounts for particle diameter. GIW VSCALC is a composite method that automatically selects between the Wilson-GIW model for coarser particles (d50 ≥ 150 microns) and the Thomas 1979 and Thomas 2015 models for finer particles (d50 ≤ 150 microns), capping results against the Wilson 1992 upper bound to prevent physically unrealistic predictions.
Beginning V3.54, GIW VSCALC is the default and recommended starting point for most applications because it handles both fine and coarse particle regimes automatically, removing the need to manually pre-select a correlation based on particle size. All three methods assume a Newtonian carrier fluid — if the carrier is non-Newtonian, deposition velocity correlations cannot be applied. See the settling slurry piping workflow for a complete worked example.
Check out GIW VSCALC method
Learn how the GIW VSCALC method simplifies complex deposition velocity calculation by intelligently selecting the most appropriate correlation based on slurry characteristics.
Accounting for Pipe Inclination
Pipe inclination has a significant effect on the velocity required to prevent deposition. Upward-inclined pipes require higher velocities because gravity acts against suspension; downward-inclined pipes require less. The Wilson-Tse 1984 correlation corrects horizontal deposition velocities for inclination angles from -20° to +80° from horizontal and is the default method in FluidFlow.
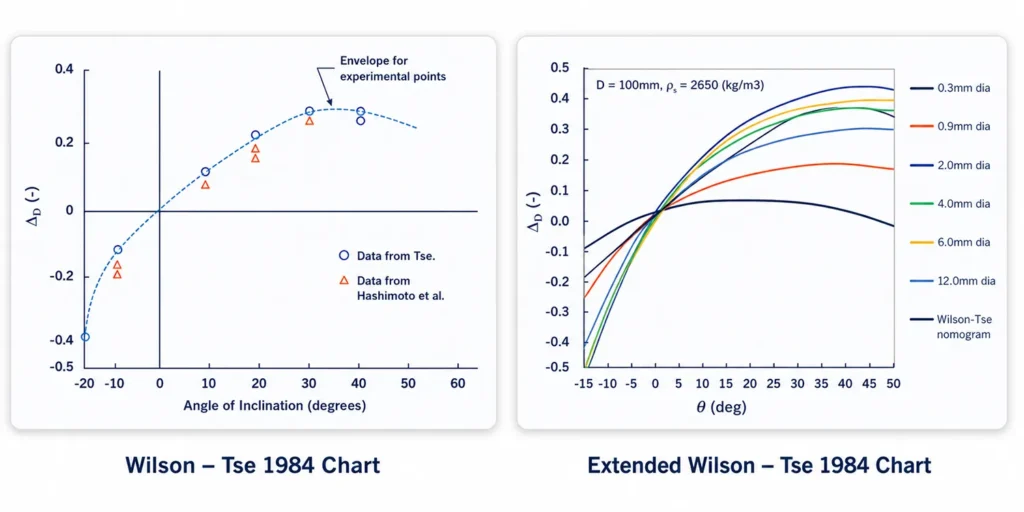
For slurries with a particle size to pipe diameter ratio (d50/D) between 0.003 and 0.04, the extended Matousek et al. 2019 model provides a more accurate correction by accounting for this ratio explicitly. It can yield meaningfully lower deposition velocity corrections than the original 1984 chart and is particularly relevant for dredging and coarse-particle mining applications.
Friction Loss Correlations: Matching the Method to Available Data
Settling slurry friction loss is calculated using the additive pressure drop principle: total pressure drop equals the carrier fluid contribution (via the Darcy-Weisbach equation) plus the solids contribution (via an empirical correlation). The right correlation depends on what data you have and the nature of your slurry.
Durand uses only d50 and is the simplest method, but errors of 100% or more are possible due to its simplified assumptions. It is appropriate only when minimal solids data is available and a rough first estimate is sufficient.
Wasp separates the slurry into stratified and homogeneous concentration layers, treating each differently. It requires particle size distribution data and gives meaningfully better accuracy than Durand when that data is available.
Liu-Dezhong is the only horizontal correlation that handles non-Newtonian carrier fluids, making it the required choice when the carrier exhibits non-Newtonian behavior.
The VSM correlation is designed for fully stratified flow or as a preliminary estimate when particle size data is unavailable altogether. It uses deposition velocity as its primary input, making it the appropriate fallback when only density and concentration are known.
The Four Component Model (4CM) is the most comprehensive approach, accounting for all flow regimes — pseudo-homogeneous, heterogeneous, and stratified — by computing the additive contributions of different particle fractions. It is the default and recommended method in FluidFlow when full particle size data is available.
Vertical pipe segments in settling slurry systems require dedicated friction loss correlations, as the flow physics differ significantly from horizontal transport. FluidFlow provide these correlation options:
- Vertical WASC,
- Vertical 4CM (which pairs with the horizontal 4CM default)
- Spelay et al. 2017 Collisional Stress Model
As a compatibility rule, FluidFlow will default (or revert) to Vertical Pipe WASC Loss when you select pre‑V3.54 horizontal correlations (e.g., Durand, Wasp, Liu‑Dezhong, WASC) or when the (VSM) horizontal method is used. For duties involving coarse solids at high concentration, the Spelay 2017 model is preferred when you want to capture particle–wall (collisional) stresses and it typically predicts the highest vertical losses of the available methods. Vertical 4CM maintains consistency with the 4CM framework but treats heterogeneous/stratified contributions as effectively pseudo‑homogeneous in vertical flow, reflecting the tendency toward full suspension in vertical transport.
Pump Performance: Accounting for Slurry Derating
Centrifugal pump performance curves from manufacturers are based on water testing. Slurries degrade that performance through two mechanisms, and both need to be addressed in the model.
For non-settling (non-Newtonian) slurries, the variable viscosity through the pump internals reduces head and efficiency. Because the shear rates inside a pump cannot be directly modeled, this is typically handled using the Fixed Reduction Ratio method, where head and efficiency ratios are obtained from manufacturer data or laboratory testing and applied directly in FluidFlow.
For settling slurries, coarse particles cause additional internal friction loss — a phenomenon known as pump derating. FluidFlow offers five derating methods ranging from the basic Fixed Reduction Ratio to the comprehensive GIW 4CM method. When limited data is available, the ANSI Monosize (2021) method offers a practical balance: it requires only d50, volumetric concentration, solids density, impeller diameter, and fines fraction — all values typically accessible even in early design stages.
Classification Edge Cases: When the Rules Don’t Fit Neatly
The most common modeling mistake with slurries is applying an approach too rigidly based on particle size alone. A few important scenarios to keep in mind:
A slurry with particles predominantly above 75 microns is not automatically a settling slurry from a modeling standpoint. If laboratory testing or scale-up tests confirm non-Newtonian rheological behavior — as in the case of a bauxite slurry with shear-dependent viscosity confirmed by viscometry — the liquid-only approach with a non-Newtonian viscosity model is the correct choice. Particle size is a default proxy for classification, not a definitive rule.
Conversely, a homogeneous paste or tailings stream where solid and liquid behave as a unified fluid may be better represented as a non-Newtonian liquid even if particle size would nominally suggest a settling approach. And note that deposition velocity correlations are only valid for settling slurries with Newtonian carrier fluids — if the carrier is non-Newtonian, deposition analysis cannot be performed through these methods regardless of how the slurry is classified.
The modeling approach should always reflect the best available evidence about how the slurry actually behaves, not just what particle size alone implies.
Summary: Choosing the Right Approach for Your Data
The two fundamental approaches — liquid-only flow for non-settling slurries and liquid-solid flow for settling slurries — each have well-defined data requirements and correlation frameworks. The challenge in practice is making good decisions when data is incomplete.
When laboratory or scale-up test data is unavailable, the 75-micron threshold gives a robust starting classification. When rheometry data is available but sparse, curve fitting and R² evaluation in FluidFlow identify the best-fit model without guesswork. When only d50 and d85 are known rather than a full sieve analysis, FluidFlow synthesizes a complete particle size distribution automatically. When correlation selection is uncertain, the defaults — GIW VSCALC for deposition velocity and 4CM for friction loss — are calibrated against large-scale experimental data and cover a wide range of conditions. And when data uncertainty is significant, running the model with multiple fluid or correlation options provides a structured sensitivity analysis.
Slurries will always demand more careful thought than simple liquids. But with a clear understanding of the available approaches and the tools to implement them rigorously, engineers can build models that are both technically sound and practically defensible.
FAQ
Q: What is a slurry?
A: A slurry is a liquid-solid mixture where solid particles are dissolved, suspended, or transported within a carrier fluid. They appear across virtually every process industry — from ore concentrate pipelines in mining and catalyst transport in chemical processing, to fruit pulp handling in food production and sludge transport in wastewater systems.
Q: What is the 75-micron threshold for slurry classification?
A: The 75-micron threshold is an industry-standard fallback for classifying slurries when laboratory data isn’t available. Slurries with particles 75 microns or smaller are classified as non-settling; those with particles larger than 75 microns are treated as settling. It’s based on the observation that finer particles typically form homogeneous mixtures at industry-relevant velocities. Importantly, it’s a default guideline — not a definitive rule — and should be overridden when laboratory or scale-up test data suggests otherwise.
Q: What is deposition velocity?
A: Deposition velocity is the minimum flow velocity needed to prevent solid particles from forming a stationary bed at the bottom of a pipe. Operating below it risks a blockage that may require manual intervention to clear. The key design target is the Maximum Deposition Limit Velocity (VSM), and standard industry practice is to design operating velocities at least 130% of VSM to maintain a safe margin.
Q: What is pump derating in slurry systems?
A: Pump derating refers to the reduction in centrifugal pump performance when handling slurries compared to the manufacturer’s water-based curves. For settling slurries, coarse particles cause additional internal friction loss that degrades head and efficiency. For non-settling (non-Newtonian) slurries, variable viscosity through the pump internals is the main cause. Both effects must be accounted for in the model — typically using fixed reduction ratios from manufacturer data or empirical methods like ANSI Monosize (2021).
Q: What is the difference between non-settling and settling slurries?
A: Non-settling slurries contain fine particles (typically ≤75 microns) that remain uniformly suspended at industry-relevant flow rates, behaving as a pseudo-homogeneous, often non-Newtonian fluid. Settling slurries contain coarser particles that will settle to the pipe bottom within about one hour of becoming stagnant. Their behavior is strongly velocity-dependent — at low velocities particles form a stationary bed, then begin to slide, and only become fully suspended at higher velocities through turbulence.
Q: Which rheology model should I use for a non-Newtonian slurry?
A: Power Law suits fluids with no yield stress but shear-dependent viscosity. Bingham Plastic applies when the fluid has a yield stress and then flows linearly. Herschel-Bulkley combines both — a yield stress plus non-linear behavior — and is widely used for mining, drilling, and food processing streams. Casson is used for pigment suspensions, chocolate, blood, and similar biological or food materials. So it depends on the shear behavior of your specific slurry. When viscometry data is available, curve fitting with R² evaluation in FluidFlow identifies the best fit objectively.
Q: What is the Maximum Deposition Limit Velocity (VSM)?
A: VSM is the peak velocity on the stationary deposit zone curve — the point above which solids will not form a stationary bed at any concentration. It is the primary safety benchmark for settling slurry system design. FluidFlow offers three correlations to calculate it: the Wilson-Addie-Sellgren-Clift (WASC) method, the Wilson 1997 particle-size-based method, and GIW VSCALC — the recommended default from v3.54 onward, as it automatically handles both fine and coarse particle regimes.
Why Getting Your Slurry Model Right Matters
Slurry systems will always be more demanding than standard liquid pipelines — but that complexity becomes manageable when engineers apply the right modeling approach for their specific slurry type and data availability. Whether working with non-settling non-Newtonian fluids or coarse settling slurries, the frameworks covered here provide a clear, defensible path from classification through to pump sizing. Get the model right from the start, and the costly consequences of undersized pumps, blocked pipelines, and unplanned shutdowns become engineering problems you’ve already solved on paper. FluidFlow lets you answer all of them in a single model, before steel is cut. These modeling approaches are available in FluidFlow’s slurry module.
FLUIDFLOW ADVANCED TRAINING
Master Slurries and Non-Newtonian Flow
Hands-on training with worked exercises for settling slurry inlet boundaries, deposition velocity selection, inclined pipe analysis, and non-Newtonian rheology modeling.